Pyramid Diagram

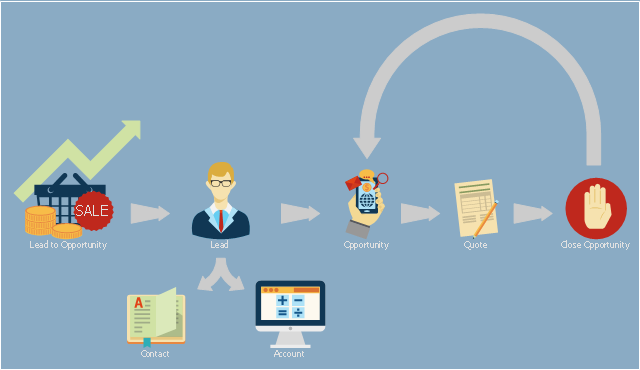
This presales process flowchart example depicts the Microsoft Dynamics CRM workflow from lead to opportunity. It was redesigned from the Wikimedia Commons file: Lead to Opportunity sales flow.svg. [commons.wikimedia.org/ wiki/ File:Lead_ to_ Opportunity_ sales_ flow.svg]
"Presales is a process or a set of activities normally carried out before a customer is acquired, though sometimes presales also extends into the period the product or service is delivered to the customer. ...
In a typical sales cycle the stages are:
(1) Contact.
(2) Lead / Suspect.
(3) Prospect / Opportunity.
The task of a presales person starts from the initial contact phase and often ends once the customer is acquired i.e. sale is made." [Presales. Wikipedia]
The process flowchart example "Lead to opportunity sales flow" was created using the ConceptDraw PRO diagramming and vector drawing software extended with the Sales Flowcharts solution from the Marketing area of ConceptDraw Solution Park.
Presales process flowchart
Process Flow Diagram Symbols

This circular arrows diagram sample shows business process management life cycle.
It was designed on the base of the Wikimedia Commons file: Business Process Management Life-Cycle.svg. [commons.wikimedia.org/ wiki/ File:Business_ Process_ Management_ Life-Cycle.svg]
This file is licensed under the Creative Commons Attribution-Share Alike 3.0 Unported license. [creativecommons.org/ licenses/ by-sa/ 3.0/ deed.en]
"BPM life-cycle.
Business process management activities can be grouped into six categories: vision, design, modeling, execution, monitoring, and optimization.
Functions are designed around the strategic vision and goals of an organization. Each function is attached with a list of processes. Each functional head in an organization is responsible for certain sets of processes made up of tasks which are to be executed and reported as planned. Multiple processes are aggregated to function accomplishments and multiple functions are aggregated to achieve organizational goals." [Business process management. Wikipedia]
The arrow donut chart example "BPM life cycle" was created using the ConceptDraw PRO diagramming and vector drawing software extended with the Circular Arrows Diagrams solution from the area "What is a Diagram" of ConceptDraw Solution Park.
Circular arrows diagram

UML Sequence Diagram Example. SVG Vectored UML Diagrams Tools
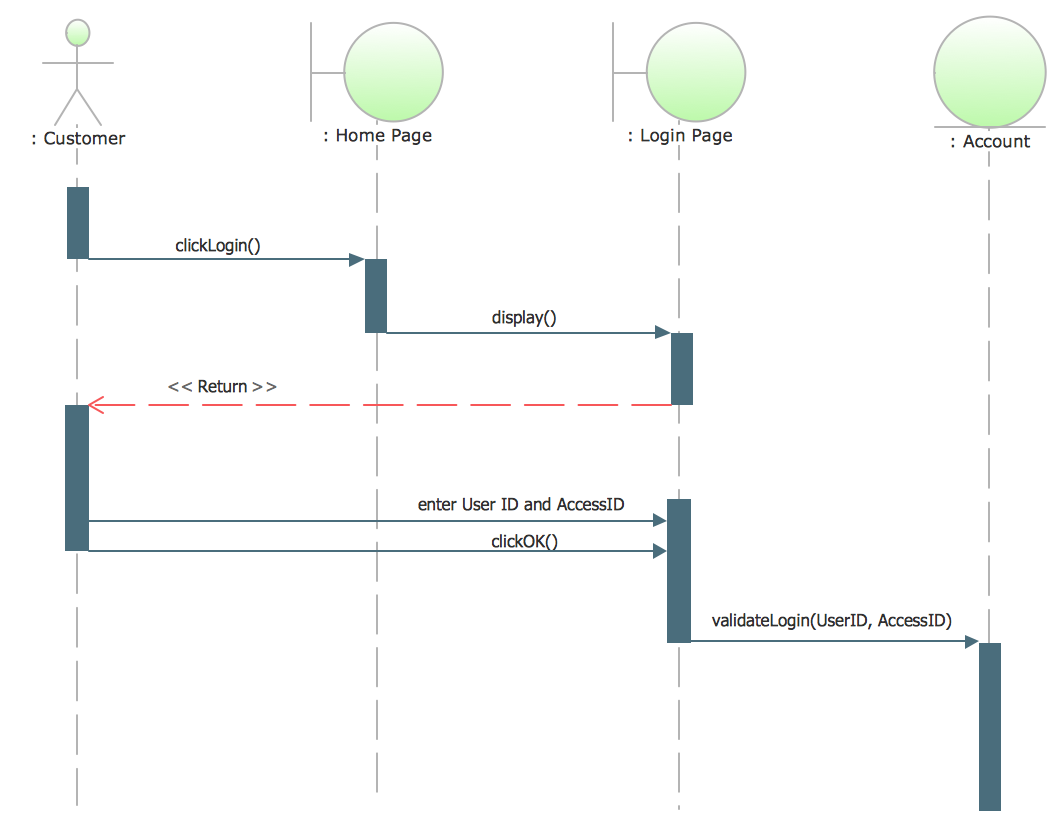
This sample shows the interactions of the customer with the system and is used at the registration on the sites.
Pyramid Diagram

Business Process Flowchart Symbols

How to draw Metro Map style infographics? Moscow, New York, Los Angeles, London

Process Flow Chart Software Free

Flowcharts Solution offers wide set of useful drawing tools, collection of samples, ready-to-use template and 2 libraries with predesigned vector elements which will help facilitate drawing process and designing professional looking process flow chart, process flow scheme, process block diagram, etc.
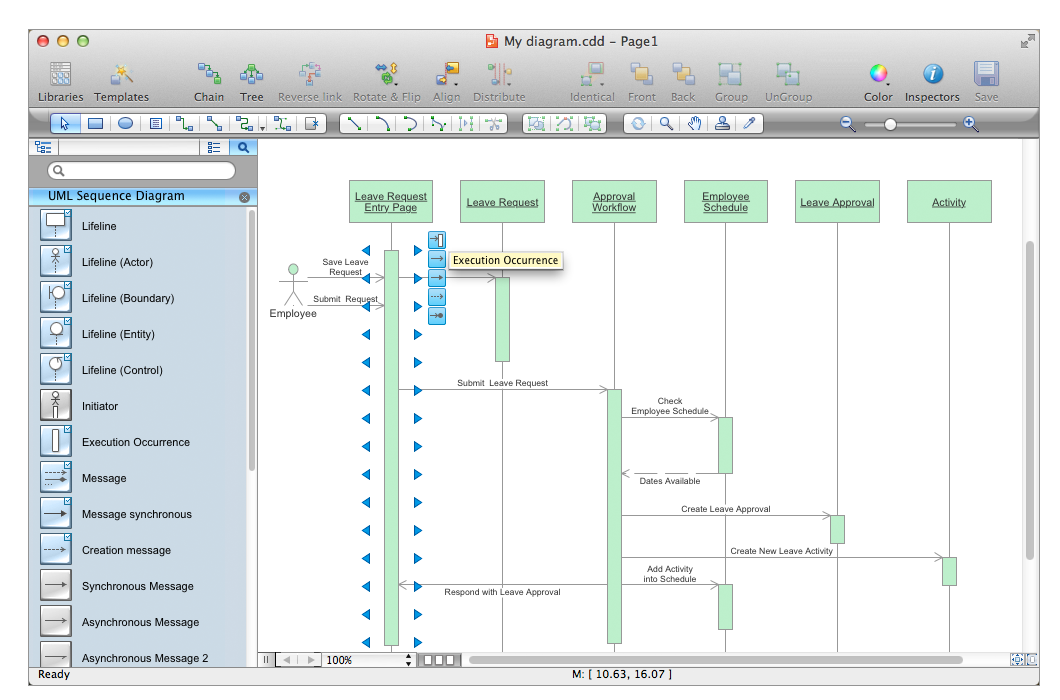
Design Elements for UML Diagrams
Pyramid Diagram

Best Flowcharts

Conceptdraw DIAGRAM - feature-rich flowchart software. It will allow you to create professional looking flowcharts.
Pyramid Diagram

Flow Diagram Software

Flowchart Software

ConceptDraw DIAGRAM flowchart software will help to quickly create new flowcharts, workflow, NS Diagram, BPMN Diagram, Cross-functional flowcharts, data flow diagrams and highlight flowcharts.
Feature-rich flowchart maker, free thousand flowchart examples and templates and colored symbols that will allow you to create professional looking flowcharts simply.
ConceptDraw DIAGRAM supports macOS and Windows.

- Process Chart Svg
- DroidDia prime | Lead to opportunity sales flow | Pyramid Diagram ...
- Process Flowchart | UML Sequence Diagram Example. SVG ...
- Flow Chart Symbols Svg
- Svg Symbols Process Flow Diagram
- Audit Flowcharts | Process Flowchart | UML Sequence Diagram ...
- Svg Gantt Chart
- Process Behavior Chart
- Svg Flow Chart
- BPM life cycle | IDEF0 diagram - Inter-box connections | Business ...
- Browser Svg Flow Charts Arrows
- Svg Geo Dashboard Charts Examples
- Circular Diagram | Sales Process Flowchart . Flowchart Examples ...
- Process Flow Diagram Symbols | Active indirect water heater ...
- Business Process Diagrams | Process Flowchart | Business Process ...
- Quality Control Chart Software — ISO Flowcharting | Flow chart ...
- Ishikawa fishbone diagram | Pyramid Diagram | San Francisco CA ...
- Behavior Chart Examples
- UML Sequence Diagram Example. SVG Vectored UML Diagrams ...
- Invoice lifecycle | Flowchart Example: Flow Chart of Marketing ...
- ERD | Entity Relationship Diagrams, ERD Software for Mac and Win
- Flowchart | Basic Flowchart Symbols and Meaning
- Flowchart | Flowchart Design - Symbols, Shapes, Stencils and Icons
- Flowchart | Flow Chart Symbols
- Electrical | Electrical Drawing - Wiring and Circuits Schematics
- Flowchart | Common Flowchart Symbols
- Flowchart | Common Flowchart Symbols