This example was redesigned from the Wikipedia file: LastResortHotel BookRoom Process.png. [en.wikipedia.org/ wiki/ File:LastResortHotel_ BookRoom_ Process.png]
This file is licensed under the Creative Commons Attribution-ShareAlike 3.0 License. [creativecommons.org/ licenses/ by-sa/ 3.0/ ]
"Event partitioning is an easy-to-apply systems analysis technique that helps the analyst organize requirements for large systems into a collection of smaller, simpler, minimally-connected, easier-to-understand ‘mini systems’ / use cases. ...
Defining requirements.
Single process in a fictitious hotel using data flow diagram notation.
Single use case in a fictitious hotel using use case diagram notation.
This approach helps the analyst to decompose the system into ‘mentally bite-sized’ mini-systems using events that require a planned response. The level of detail of each response is at the level of ‘primary use cases’. Each planned response may be modelled using DFD notation or as a single use case using use case diagram notation.
The basic flow within a process or use case can usually be described in a relatively small number of steps, often fewer than twenty or thirty, possibly using something like ‘structured English’. Ideally, all of the steps would be visible all at once (often a page or less). The intention is to reduce one of the risks associated with short-term memory, namely, forgetting what is not immediately visible (‘out of sight, out of mind’). ...
Single process in a fictitious hotel using data flow diagram notation." [Event partitioning. Wikipedia]
The DFD example "Last resort hotel book room process" was created using the ConceptDraw PRO diagramming and vector drawing software extended with the Data Flow Diagrams solution from the Software Development area of ConceptDraw Solution Park.
DFD

This arrow loop diagram sample was created on the base of the figure illustrating the article "Up Close and Personal. Life as an Intelligence Analyst" from the FBI website. [fbi.gov/ news/ stories/ 2006/ may/ arias050506]
"The traditional Intelligence cycle is the fundamental cycle of intelligence processing in a civilian or military intelligence agency or in law enforcement as a closed path consisting of repeating nodes. The stages of the intelligence cycle include the issuance of requirements by decision makers, collection, processing, analysis, and publication of intelligence. The circuit is completed when decision makers provide feedback and revised requirements. The intelligence cycle is also called the Intelligence Process by the U.S. Department of Defense (DoD) and the uniformed services." [Intelligence cycle. Wikipedia]
The arrow loop diagram example "Intelligence analyst cycle" was created using the ConceptDraw PRO diagramming and vector drawing software extended with the Target and Circular Diagrams solution from the Marketing area of ConceptDraw Solution Park.
www.conceptdraw.com/ solution-park/ marketing-target-and-circular-diagrams
Arrow loop diagram
 Business Processes Area
Solutions of Business Processes area extend ConceptDraw PRO software with samples, templates and vector stencils libraries for drawing business process diagrams and flowcharts for business process management.
 Cross-Functional Flowcharts
Cross-functional flowcharts are powerful and useful tool for visualizing and analyzing complex business processes which requires involvement of multiple people, teams or even departments. They let clearly represent a sequence of the process steps, the order of operations, relationships between processes and responsible functional units (such as departments or positions).
This IDEF3 diagram example was redesigned from the Wikimedia Commons file: 5-21 Completed Transition Schematic.jpg.
[commons.wikimedia.org/ wiki/ File:5-21_ Completed_ Transition_ Schematic.jpg]
"As with the Process Schematic, the correctness of the Object Schematic and
associated elaborations are confirmed through validation with the domain expert. After reviewing the Transition Schematic, the domain expert observes that the allowable state transitions displayed in the schematic do not include those representative of a failed request. ...
The domain expert also identified transitions through which the identity of the object was preserved and transitions where the object was actually transformed into an entirely different object. The domain expert’s comments to the analyst yield the schematic
depicted in Figure 5-21." [IDEF3 Process Description Capture Method Report AL-TR-1995-XXXX. idef.com/ pdf/ Idef3_ fn.pdf]
The sample "Completed transition schematic - IDEF3 diagram" was created using the ConceptDraw PRO diagramming and vector drawing software extended with the solution "IDEF Business Process Diagrams" from the area "Business Processes" of ConceptDraw Solution Park.
IDEF3 business process diagram
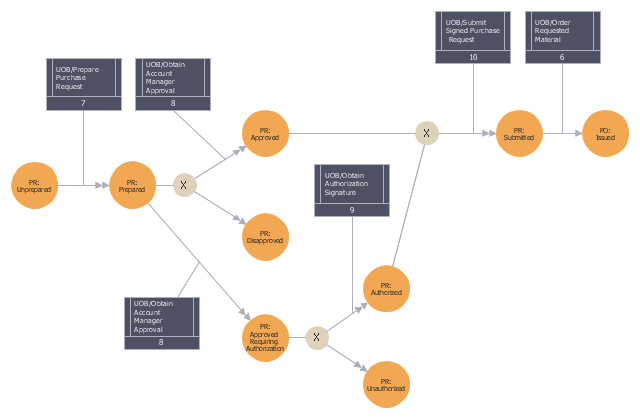
"Data flow diagrams are one of the three essential perspectives of the structured-systems analysis and design method SSADM. The sponsor of a project and the end users will need to be briefed and consulted throughout all stages of a system's evolution. With a data flow diagram, users are able to visualize how the system will operate, what the system will accomplish, and how the system will be implemented. The old system's dataflow diagrams can be drawn up and compared with the new system's data flow diagrams to draw comparisons to implement a more efficient system. Data flow diagrams can be used to provide the end user with a physical idea of where the data they input ultimately has an effect upon the structure of the whole system from order to dispatch to report. How any system is developed can be determined through a data flow diagram model.
In the course of developing a set of levelled data flow diagrams the analyst/ designers is forced to address how the system may be decomposed into component sub-systems, and to identify the transaction data in the data model.
Data flow diagrams can be used in both Analysis and Design phase of the SDLC.
There are different notations to draw data flow diagrams (Yourdon & Coad and Gane & Sarson), defining different visual representations for processes, data stores, data flow, and external entities." [Data flow diagram. Wikipedia]
The DFD (Yourdon and Coad notation) example "Process of account receivable" was created using the ConceptDraw PRO diagramming and vector drawing software extended with the Data Flow Diagrams solution from the Software Development area of ConceptDraw Solution Park.
Data Flow Diagram

- Business Process Analyst
- Business Analyst Process Mapping
- Process Flowchart | Business Processes Area | Cross-Functional ...
- Process Flowchart | Cross-Functional Flowcharts | The Best Tool for ...
- Accounting Flowcharts | How to Make an Accounting Process ...
- Process Flowchart | Basic Flowchart Symbols and Meaning | Flow ...
- Sales Flowcharts | Sales Process Management | Last resort hotel ...
- Dfd Login Process
- Last resort hotel book room process - DFD | Structured Systems ...
- Hotel Service Process | Process Flowchart | Last resort hotel book ...
- Business process diagram BPMN 1.2 - Hiring process | BPMN 2.0 ...
- Process Flowchart | Last resort hotel book room process - DFD ...
- Data Flow Diagrams (DFD) | Last resort hotel book room process ...
- Process Flowchart | Basic Flowchart Symbols and Meaning | Data ...
- Business Process Modeling Software for Mac | Business Process ...
- Cab booking public process - Collaboration BPMN 2.0 diagram ...
- Flow Chart of Marketing Analysis
- Business Process Modeling Notation Template | How to Create a ...
- Taxi service order procedure - BPMN 1.2 diagram | Taxi order ...
- BPMN 2.0 | How to Create a BPMN Diagram Using Border Events in ...
- ERD | Entity Relationship Diagrams, ERD Software for Mac and Win
- Flowchart | Basic Flowchart Symbols and Meaning
- Flowchart | Flowchart Design - Symbols, Shapes, Stencils and Icons
- Flowchart | Flow Chart Symbols
- Electrical | Electrical Drawing - Wiring and Circuits Schematics
- Flowchart | Common Flowchart Symbols
- Flowchart | Common Flowchart Symbols