Cause and Effect Analysis


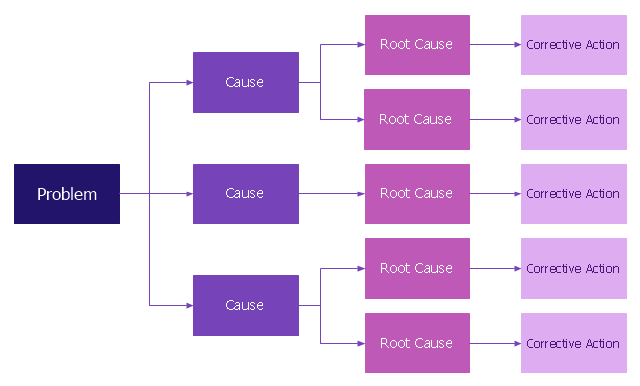
Root cause analysis (RCA) tree diagram lets identify the root causes for a factor and then list possible corrective action. The diagram displays the structure of causes for a factor and possible corrective actions. The root cause analysis tree diagram is used for further formulation of actions.
"Tree Diagram.
This tool is used to break down broad categories into finer and finer levels of detail. It can map levels of details of tasks that are required to accomplish a goal or solution or task. Developing the tree diagram helps one move their thinking from generalities to specifics." [Seven Management and Planning Tools. Wikipedia]
This root cause analysis tree diagram template for the ConceptDraw PRO diagramming and vector drawing software is included in the Seven Management and Planning Tools solution from the Management area of ConceptDraw Solution Park.
RCA diagram
HelpDesk
How To Create Root Cause Analysis Diagram Using ConceptDraw Office

 ConceptDraw Solution Park
ConceptDraw Solution Park collects graphic extensions, examples and learning materials
Process Flowchart


 Seven Management and Planning Tools
Seven Management and Planning Tools solution extends ConceptDraw PRO and ConceptDraw MINDMAP with features, templates, samples and libraries of vector stencils for drawing management mind maps and diagrams.
 Fishbone Diagrams
The Fishbone Diagrams solution extends ConceptDraw PRO v10 software with the ability to easily draw the Fishbone Diagrams (Ishikawa Diagrams) to clearly see the cause and effect analysis and also problem solving. The vector graphic diagrams produced using this solution can be used in whitepapers, presentations, datasheets, posters, and published technical material.
HelpDesk
How to Manage Problem Solving Using Seven Management and Planning Tools

 Seven Management and Planning Tools
Seven Management and Planning Tools solution extends ConceptDraw PRO and ConceptDraw MINDMAP with features, templates, samples and libraries of vector stencils for drawing management mind maps and diagrams.
 Quality Mind Map
This solution extends ConceptDraw MINDMAP software with Quality Management Mind Maps (Presentations, Meeting Agendas, Problem to be solved).
 Value Stream Mapping
Value stream mapping solution extends ConceptDraw PRO software with templates, samples and vector stencils for drawing the Value Stream Maps (VSM) in lean manufacturing practice.
PDPC

 ATM UML Diagrams
The ATM UML Diagrams solution lets you create ATM solutions and UML examples. Use ConceptDraw PRO as a UML diagram creator to visualize a banking system.
Affinity Diagram

 Event-driven Process Chain Diagrams
Event-driven Process Chain (EPC) Diagram is a type of flowchart widely used for modeling in business engineering and reengineering, business process improvement, and analysis. EPC method was developed within the Architecture of Integrated Information Systems (ARIS) framework.
 Seating Plans
The correct and convenient arrangement of tables, chairs and other furniture in auditoriums, theaters, cinemas, banquet halls, restaurants, and many other premises and buildings which accommodate large quantity of people, has great value and in many cases requires drawing detailed plans. The Seating Plans Solution is specially developed for their easy construction.
 Audit Flowcharts
Audit flowcharts solution extends ConceptDraw PRO software with templates, samples and library of vector stencils for drawing the audit and fiscal flow charts.
Activity on Node Network Diagramming Tool

This sample shows the Activity on node network diagramming method. It was created in ConceptDraw PRO diagramming and vector drawing software using the Seven Management and Planning Tools solution from the Management area of ConceptDraw Solution Park.
- Root cause analysis tree diagram template | Root cause analysis
- Root cause analysis tree diagram - Manufacturing problem solution
- Root cause analysis tree diagram template | Fault Tree Diagram ...
- Cause and Effect Analysis (Fishbone Diagrams) | PROBLEM ...
- Root cause analysis tree diagram template
- Fault tree analysis diagram
- Fishbone Diagram | Fault Tree Analysis Diagrams | TOWS analysis ...
- PROBLEM ANALYSIS Root Cause Analysis Tree Diagram | Seven ...
- Fault Tree Analysis Diagrams | Root cause analysis tree diagram ...
- Lean Manufacturing Diagrams | Root cause analysis tree diagram ...
- Business Productivity Area | Fault Tree Analysis Diagrams | Seven ...
- Fault Tree Analysis Diagrams | Root cause analysis tree diagram ...
- Fault Tree Analysis Diagrams | ConceptDraw Solution Park | Word ...
- Root cause analysis tree diagram template | Cause & Effect Analysis ...
- Fault tree analysis diagram template | Graphics Software for ...
- Audit failure - Fault tree analysis diagram | Design elements - Fault ...
- FTA diagram - Hazard analysis | Accident analytic tree - FTA ...
- Fault Tree Analysis Diagrams | How to Create a Fault Tree Diagram ...
- Decision tree diagram | Decision Making | Influence Diagram ...
- PROBLEM ANALYSIS Root Cause Analysis Tree Diagram ...
- ERD | Entity Relationship Diagrams, ERD Software for Mac and Win
- Flowchart | Basic Flowchart Symbols and Meaning
- Flowchart | Flowchart Design - Symbols, Shapes, Stencils and Icons
- Flowchart | Flow Chart Symbols
- Electrical | Electrical Drawing - Wiring and Circuits Schematics
- Flowchart | Common Flowchart Symbols
- Flowchart | Common Flowchart Symbols