"Decision-making can be regarded as the cognitive process resulting in the selection of a belief and/ or a course of action among several alternative possibilities. Every decision-making process produces a final choice that may or may not prompt action. ...
Decision-making can also be regarded as a problem-solving activity terminated by a solution deemed to be satisfactory. It is, therefore, a reasoning or emotional process which can be rational or irrational and can be based on explicit assumptions or tacit assumptions. Most decisions are followed by some form of cost-benefit analysis. Rational choice theory encompasses the notion that people try to maximize benefits while minimizing costs.
Some have argued that most decisions are made unconsciously, if not involuntarily. Jim Nightingale, author of Think Smart – Act Smart, states that "we simply decide without thinking much about the decision process. ...
A major part of decision-making involves the analysis of a finite set of alternatives described in terms of evaluative criteria. Information overload occurs when there is a substantial gap between the capacity of information and the ways in which people may or can adapt."" [Decision-making. Wikipedia]
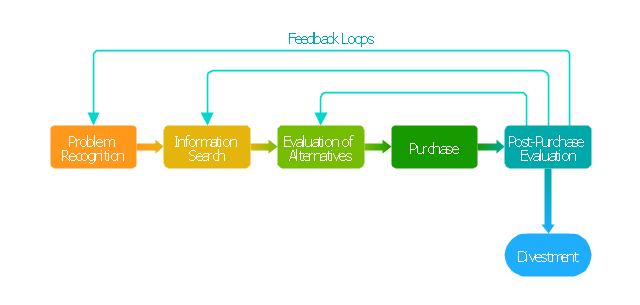
The block diagram example "Customer decision making" was created using the ConceptDraw PRO diagramming and vector drawing software extended with the Block Diagrams solution from the area "What is a Diagram" of ConceptDraw Solution Park.
Decision-making can also be regarded as a problem-solving activity terminated by a solution deemed to be satisfactory. It is, therefore, a reasoning or emotional process which can be rational or irrational and can be based on explicit assumptions or tacit assumptions. Most decisions are followed by some form of cost-benefit analysis. Rational choice theory encompasses the notion that people try to maximize benefits while minimizing costs.
Some have argued that most decisions are made unconsciously, if not involuntarily. Jim Nightingale, author of Think Smart – Act Smart, states that "we simply decide without thinking much about the decision process. ...
A major part of decision-making involves the analysis of a finite set of alternatives described in terms of evaluative criteria. Information overload occurs when there is a substantial gap between the capacity of information and the ways in which people may or can adapt."" [Decision-making. Wikipedia]
The block diagram example "Customer decision making" was created using the ConceptDraw PRO diagramming and vector drawing software extended with the Block Diagrams solution from the area "What is a Diagram" of ConceptDraw Solution Park.
Block diagram
 Management
This solution extends ConceptDraw PRO v9 and ConceptDraw MINDMAP v7 with Management Diagrams and Mind Maps (decision making, scheduling, thinking ideas, problem solving, business planning, company organizing, SWOT analysis, preparing and holding meetings
Influence Diagram Software

This sample shows the Influence diagram. It is a directed acyclic graph with three types of nodes: Decision node is drawn as a rectangle, Uncertainty node is drawn as an oval, Value node is drawn as an octagon. The nodes are connected with arcs.
HelpDesk
How to Create a Fishbone (Ishikawa) Diagram Quickly

PDPC

HelpDesk
How to Draw a Fishbone Diagram with ConceptDraw PRO

Workflow Diagram

The workflow represents the transferring of data, documents or tasks during a work process. To make it easier to study and analyze working processes, and to present them in a simple visual manner, workflow diagrams are used. To create these diagrams professional use workflow diagram maker software ConceptDraw PRO.
 Management Area
The solutions from Management area of ConceptDraw Solution Park collect templates, samples and libraries of vector stencils for drawing the management diagrams and mind maps.
HelpDesk
How to Draw an Organizational Chart Using ConceptDraw PRO

Basic Flowchart Symbols and Meaning


HelpDesk
How to Draw a Pyramid Diagram in ConceptDraw PRO

HelpDesk
How to Create SWOT Analysis Template Using ConceptDraw PRO

HelpDesk
How to Create a Bar Chart in ConceptDraw PRO

Bar charts are widely used to show and compare the values of the same parameters for different data groups.
The bar graph can be vertical or horizontal. This depends on the amount of categories. There are many methods in which bar graph can be built and this makes it a very often used chart type. Usually, a bar chart is created so that the bars are placed vertically. Such arrangement means that the bar's height value is proportional to the category value. Nevertheless, a bar chart can be also drawn horizontally. This means that the longer the bar, the bigger the category. Thus, a bar chart is a good way to present the relative values of different measured items. The ConceptDraw Bar Graphs solution allows you to draw a bar chart quickly using a vector library, containing the set of various bar charts objects.
HelpDesk
How to Make an Ansoff Matrix Template in ConceptDraw PRO

HelpDesk
How to Draw a Line Chart Quickly

- Decision Making | Block diagram - Customer decision making ...
- Block diagram - Customer decision making | Decision Making Can ...
- Block diagram - Customer decision making | Basic Flowchart ...
- Decision Making | How To Make the Right Decision in Projects ...
- Block diagram - Customer decision making | Workflow Diagram ...
- Block diagram - Customer decision making | Block Diagram ...
- Block diagram - Customer decision making | Basic Flowchart ...
- Block diagram - Customer decision making | PROBLEM ANALYSIS ...
- Block diagram - Customer decision making | Total Quality ...
- Block diagram - Customer decision making | Block Diagrams ...
- Block diagram - Customer decision making | Basic Flowchart ...
- Block diagram - Customer decision making | Influence Diagram ...
- Block diagram - Customer decision making | Cross-Functional ...
- Basic Flowchart Symbols and Meaning | Decision Making | Block ...
- Block diagram - Customer decision making | Workflow Diagram ...
- Manager Decision Making Block Diagram
- Block diagram - Customer decision making | Block Diagram Of ...
- Risk Analysis | The Action Plan | Decision Making | Preventive Of ...
- Strategic Decision Making Process Block Diagram
- With The Use Of A Diagram Illustrate The Stages Of Decision Making
- ERD | Entity Relationship Diagrams, ERD Software for Mac and Win
- Flowchart | Basic Flowchart Symbols and Meaning
- Flowchart | Flowchart Design - Symbols, Shapes, Stencils and Icons
- Flowchart | Flow Chart Symbols
- Electrical | Electrical Drawing - Wiring and Circuits Schematics
- Flowchart | Common Flowchart Symbols
- Flowchart | Common Flowchart Symbols