Bar Diagrams for Problem Solving. Create business management bar charts with Bar Graphs Solution

"Solution selling is a sales methodology. Rather than just promoting an existing product, the salesperson focuses on the customer's pain(s) and addresses the issue with his or her offerings (product and services). The resolution of the pain is what constitutes a "solution". ...
Followers of "solution-selling" generally apply a consultative sales approach to all aspects of their sales process (or during a sales cycle) including:
Prospecting;
Diagnosing customer needs;
Crafting a potential solution;
Establishing value;
Bargaining for access to decision-makers;
Positioning proof, ROI and the total solution;
Negotiating a win-win solution;
Following up to ensure customer success.
The solution selling methodology has evolved as key components of professional selling evolve. As a result, solution selling has become more broadly defined - to include dimensions of "sales process", "competitive selling", "value selling" as well as "consultative selling" or "complex selling" which set the focus on the team's aspects of the sales." [Solution selling.Wikipedia]
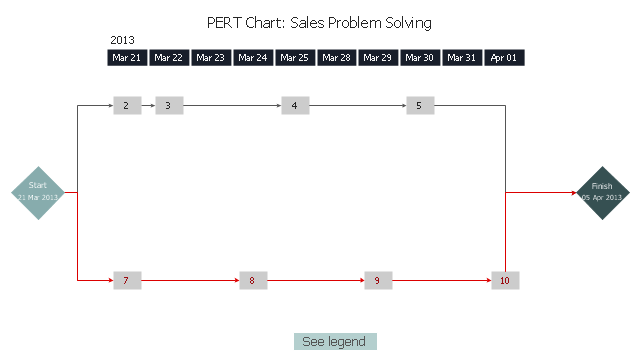
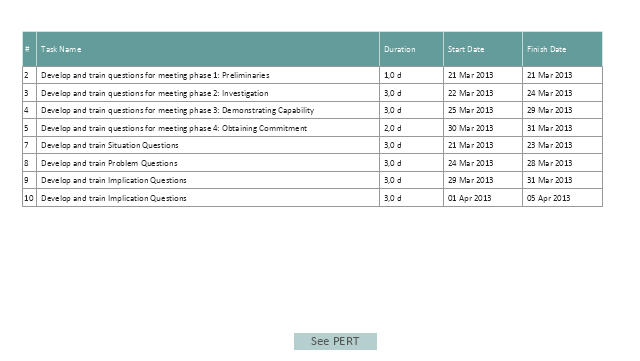
The PERT chart example "Sale problem solution" was created using the ConceptDraw PRO diagramming and vector drawing software extended with the solution Seven Management and Planning Tools from the Management area of ConceptDraw Solution Park.
Followers of "solution-selling" generally apply a consultative sales approach to all aspects of their sales process (or during a sales cycle) including:
Prospecting;
Diagnosing customer needs;
Crafting a potential solution;
Establishing value;
Bargaining for access to decision-makers;
Positioning proof, ROI and the total solution;
Negotiating a win-win solution;
Following up to ensure customer success.
The solution selling methodology has evolved as key components of professional selling evolve. As a result, solution selling has become more broadly defined - to include dimensions of "sales process", "competitive selling", "value selling" as well as "consultative selling" or "complex selling" which set the focus on the team's aspects of the sales." [Solution selling.Wikipedia]
The PERT chart example "Sale problem solution" was created using the ConceptDraw PRO diagramming and vector drawing software extended with the solution Seven Management and Planning Tools from the Management area of ConceptDraw Solution Park.
PERT
Legend
Bar Chart Examples

Bar Diagrams for Problem Solving. Create event management bar charts with Bar Graphs Solution

PERT Chart

Bar Diagrams for Problem Solving. Create economics and financial bar charts with Bar Graphs Solution

Bar Diagrams for Problem Solving. Create space science bar charts with Bar Graphs Solution

Create bar graphs for visual solving your scientific problems and data comparison using the ConceptDraw PRO diagramming and vector drawing software extended with the Bar Graphs Solution from the Graphs and Charts area of ConceptDraw Solition Park.
CORRECTIVE ACTIONS PLANNING. PERT Chart

ConceptDraw Office suite is a software for corrective actions planning.

Bar Diagrams for Problem Solving. Create manufacturing and economics bar charts with Bar Graphs Solution

Simple Flow Chart

Preventive Action
 - Minimization-of-material-wastage")
Skilled use of these diagrams makes collaborative teamwork both more engaging and more effective.
Process Flowchart


Technical Flow Chart Example

ConceptDraw PRO enhanced with Flowcharts Solution from the "Diagrams" Area of ConceptDraw Solution is a perfect software for drawing Technical Flow Chart Example illustrating the essence and importance of the technical flow chart use.
Technical Flow Chart

Technical Flow Chart can be drawn by pencil on the paper, but it will be easier to use for designing a special software. ConceptDraw PRO diagramming and vector drawing software extended with Flowcharts Solution from the "Diagrams" Area of ConceptDraw Solution Park will be useful for this goal.
Venn Diagram Examples for Problem Solving. Environmental Social Science. Human Sustainability Confluence

Create your Venn diagrams for problem solving in environmental social science using the ConceptDraw PRO diagramming and vector drawing software extended with the Venn Diagrams solution from the area "Diagrams" of ConceptDraw Solution Park.
- Flowchart Problems And Solutions Examples
- PERT chart - Sale problem solution | Bar Diagrams for Problem ...
- Pert Problems And Solutions
- Chart Showing The Problem And Solution In Engineering
- Flowchart Problems And Solution
- Process Flowchart | Bar Diagrams for Problem Solving. Create event ...
- Chart Showing The Problem The Solution And The Basic Tools In
- Pert Problems With Solution
- PERT chart - Sale problem solution | CORRECTIVE ACTIONS ...
- Example Of Chart That Showing The Engineering Solution To A
- Engineering Solution To A Problem A Chart Showing The Problem
- Flowchart Definition | Process Flowchart | Technical Flow Chart ...
- Problem Event Solution Chart Example
- Chart On Selling Problem
- Pert Chart Sample Problem And Solution
- PERT chart - Sale problem solution
- What Constitutes a Project? | PERT chart - Sale problem solution ...
- Bar Graphs | Bar Diagrams for Problem Solving. Create business ...
- Chart Examples For Problem Solving
- Problem Solution Flow Chart
- ERD | Entity Relationship Diagrams, ERD Software for Mac and Win
- Flowchart | Basic Flowchart Symbols and Meaning
- Flowchart | Flowchart Design - Symbols, Shapes, Stencils and Icons
- Flowchart | Flow Chart Symbols
- Electrical | Electrical Drawing - Wiring and Circuits Schematics
- Flowchart | Common Flowchart Symbols
- Flowchart | Common Flowchart Symbols