Root Cause Analysis

Analyze the root causes for factors that influenced the problem. This diagram is constructed separately for each highly prioritized factor. The goal of this is to find the root causes for the factor and list possible corrective action.

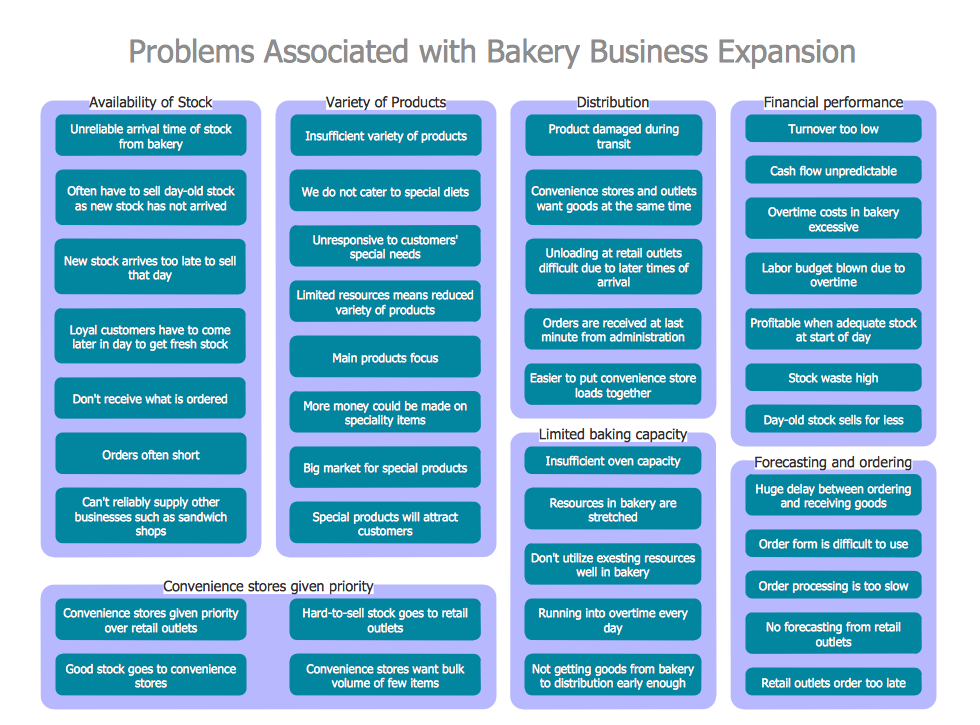
Cause and Effect Analysis

PROBLEM ANALYSIS. Relations Diagram

ConceptDraw OFFICE suite is a software for relation diagram making.
The Action Plan

ConceptDraw Office suite is a software for decision making and action plan.
Fishbone Diagram Template

ConceptDraw DIAGRAM diagramming and vector drawing software enhanced with Fishbone Diagrams solution helps you create business productivity diagrams from Fishbone diagram templates and examples, that provide to start using of the graphic method for the analysis of problem causes. Each predesigned Fishbone Diagram template is ready to use and useful for instantly drawing your own Fishbone Diagram.
Fishbone Diagram Problem Solving

To design easily the Fishbone diagram, you can use a special ConceptDraw DIAGRAM vector graphic and diagramming software which contains the powerful tools for Fishbone diagram problem solving offered by Fishbone Diagrams solution for the Management area of ConceptDraw Solution Park.
Problem Analysis
SWOT Analysis Software

PROBLEM ANALYSIS. Prioritization Matrix

Fishbone Diagram Procedure

Use a Fishbone Diagram to Attack Complex Problems

Use ConceptDraw DIAGRAM diagramming software with Fishbone Diagrams Solution to attack any complex problems with fishbone diagrams graphic method. Construct Fishbone diagram to help users brainstorm and break down a complex problem.
Cause and Effect Analysis - Fishbone Diagrams for Problem Solving

PROBLEM ANALYSIS. Identify and Structure Factors

ConceptDraw OFFICE suite is a software for identify and structure factors with affinity diagram. This is a grouping and structuring of factors that impact on a problem.
Management Tools — Total Quality Management

SWOT analysis Software & Template for Macintosh and Windows

- Problem Analysis Template
- PROBLEM ANALYSIS . Prioritization Matrix | SWOT Analysis ...
- Root cause analysis tree diagram - Template
- Cause and Effect Analysis | PROBLEM ANALYSIS . Root Cause ...
- PROBLEM ANALYSIS . Root Cause Analysis Tree Diagram | Root ...
- PROBLEM ANALYSIS . Prioritization Matrix | How to Make an Ansoff ...
- PERT chart - Template | PROBLEM ANALYSIS . Prioritization Matrix ...
- How To Create a Prioritization Matrix | Prioritization Matrix ...
- PROBLEM ANALYSIS . Prioritization Matrix | SWOT Matrix Template ...
- PROBLEM ANALYSIS . Prioritization Matrix | Matrix Organization ...
- Cause and Effect Analysis | Cause and Effect Diagram | PROBLEM ...
- Root cause analysis tree diagram - Template | Fault Tree Diagram ...
- Cause And Effect Analysis Example
- PROBLEM ANALYSIS . Prioritization Matrix | Pyramid Diagram ...
- Fault Tree Diagram | PROBLEM ANALYSIS . Root Cause Analysis ...
- Problem Analysis Format
- Fault Tree Analysis Software | Fire Evacuation Plan Template ...
- Issue Analysis Template
- Factor Tree Analysis Example
- Cause and Effect Analysis | Root Cause Analysis | PROBLEM ...
- ERD | Entity Relationship Diagrams, ERD Software for Mac and Win
- Flowchart | Basic Flowchart Symbols and Meaning
- Flowchart | Flowchart Design - Symbols, Shapes, Stencils and Icons
- Flowchart | Flow Chart Symbols
- Electrical | Electrical Drawing - Wiring and Circuits Schematics
- Flowchart | Common Flowchart Symbols
- Flowchart | Common Flowchart Symbols