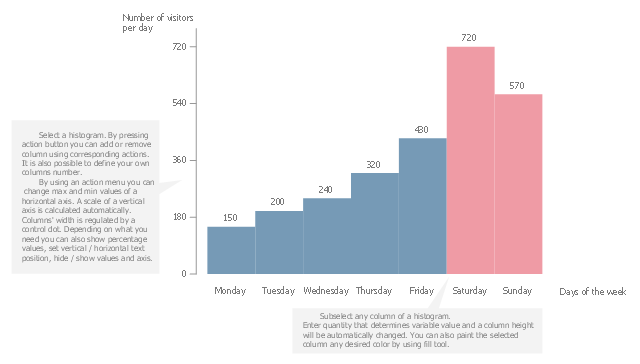
Use this chart template to design your histograms for visualization of probability distribution.
"In probability and statistics, a probability distribution assigns a probability to each measurable subset of the possible outcomes of a random experiment, survey, or procedure of statistical inference. Examples are found in experiments whose sample space is non-numerical, where the distribution would be a categorical distribution; experiments whose sample space is encoded by discrete random variables, where the distribution can be specified by a probability mass function; and experiments with sample spaces encoded by continuous random variables, where the distribution can be specified by a probability density function. More complex experiments, such as those involving stochastic processes defined in continuous time, may demand the use of more general probability measures." [Probability distribution. Wikipedia]
The chart template "Histogram" for the ConceptDraw PRO diagramming and vector drawing software is included in the Basic Histograms solution from the Graphs and Charts area of ConceptDraw Solution Park.
Template
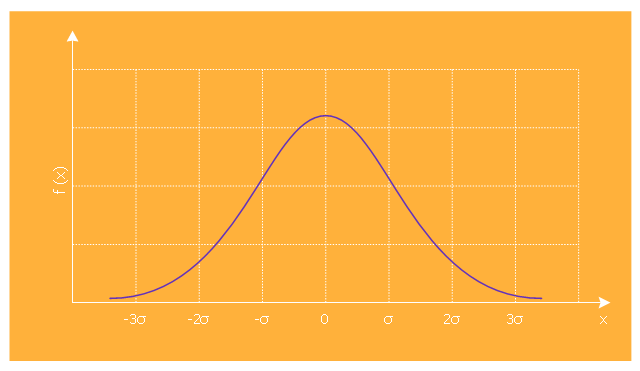
This is normal distribution graph template.
Use it to design your normal distribution graphs with ConceptDraw PRO software.
Normal (or Gaussian) distribution (bell curve) graph visualizes a continuous probability distribution that is often used as a first approximation to describe real-valued random variables that tend to cluster around a single mean value.
The marketing chart template "Normal distribution graph" is included in the Marketing Diagrams solution from the Marketing area of ConceptDraw Solution Park.
Marketing graph template
Making a Histogram

How To Make a Histogram?

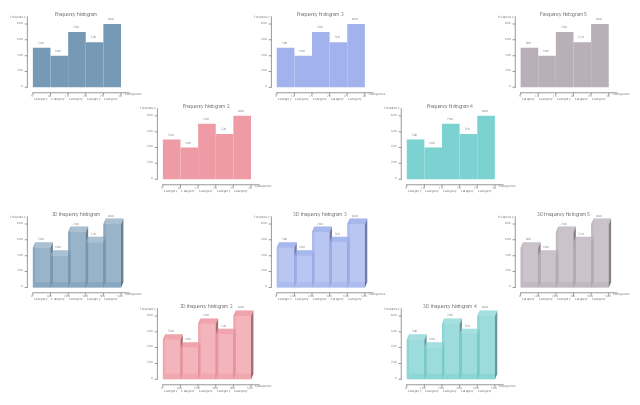
The vector stencils library "Histograms" contains 10 chart templates. Use it to design your histograms for visualizing frequency distribution data in ConceptDraw PRO diagramming and vector drawing software.
"In statistics, a histogram is a graphical representation of the distribution of data. It is an estimate of the probability distribution of a continuous variable...
A histogram is a representation of tabulated frequencies, shown as adjacent rectangles, erected over discrete intervals (bins), with an area equal to the frequency of the observations in the interval. The height of a rectangle is also equal to the frequency density of the interval, i.e., the frequency divided by the width of the interval. The total area of the histogram is equal to the number of data. A histogram may also be normalized displaying relative frequencies. It then shows the proportion of cases that fall into each of several categories, with the total area equaling 1. The categories are usually specified as consecutive, non-overlapping intervals of a variable. The categories (intervals) must be adjacent, and often are chosen to be of the same size. The rectangles of a histogram are drawn so that they touch each other to indicate that the original variable is continuous.
Histograms are used to plot the density of data, and often for density estimation: estimating the probability density function of the underlying variable. The total area of a histogram used for probability density is always normalized to 1." [Histogram. Wikipedia]
The chart templates example "Design elements - Histograms" is included in the Basic Histograms solution from the Graphs and Charts area of ConceptDraw Solution Park.
Chart templates
Histogram

How To Make Histogram in ConceptDraw DIAGRAM ?

 Histograms
How to make a Histogram? Making a Histogram is an incredibly easy process when it is done with ConceptDraw DIAGRAM. The Histograms Solution enhances ConceptDraw DIAGRAM functionality with extensive drawing tools, numerous samples, and examples; also a quick-start template and library of ready vector stencils for visualization the data and professional drawing Histograms.
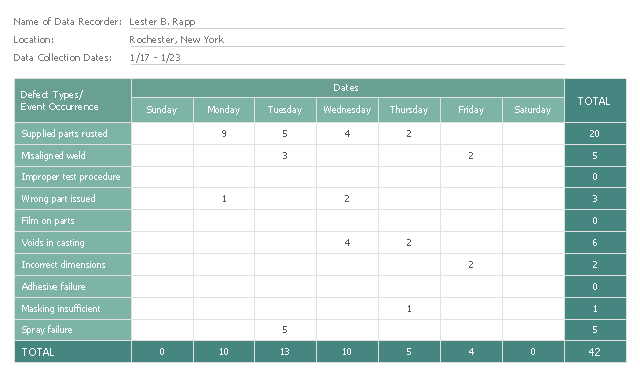
This check sheet example was redesigned from the Wikimedia Commons file: Check sheet for motor assembly.svg. [commons.wikimedia.org/ wiki/ File:Check_ sheet_ for_ motor_ assembly.svg]
This file is licensed under the Creative Commons Attribution-Share Alike 3.0 Unported license. [creativecommons.org/ licenses/ by-sa/ 3.0/ deed.en]
"The check sheet is a form (document) used to collect data in real time at the location where the data is generated. The data it captures can be quantitative or qualitative. When the information is quantitative, the check sheet is sometimes called a tally sheet.
The check sheet is one of the so-called Seven Basic Tools of Quality Control. ...
Kaoru Ishikawa identified five uses for check sheets in quality control:
- To check the shape of the probability distribution of a process
- To quantify defects by type
- To quantify defects by location
- To quantify defects by cause (machine, worker)
- To keep track of the completion of steps in a multistep procedure (in other words, as a checklist)" [. Wikipedia]
The example "Check sheet for motor assembly" was created using the ConceptDraw PRO software extended with the Seven Basic Tools of Quality solution from the Quality area of ConceptDraw Solution Park.
Check sheet example
Used Solutions
Quality
>
Probability Quality Control Tools

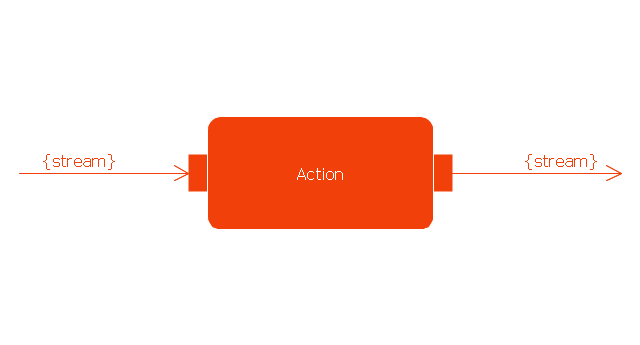
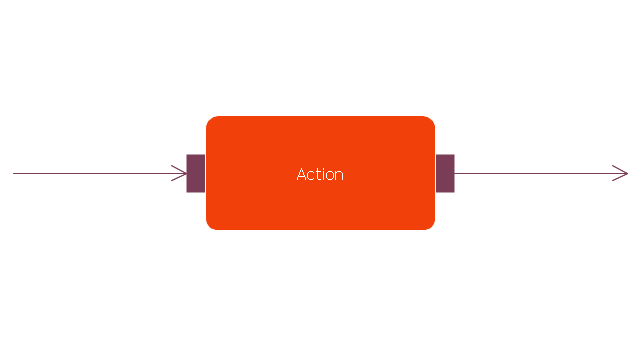
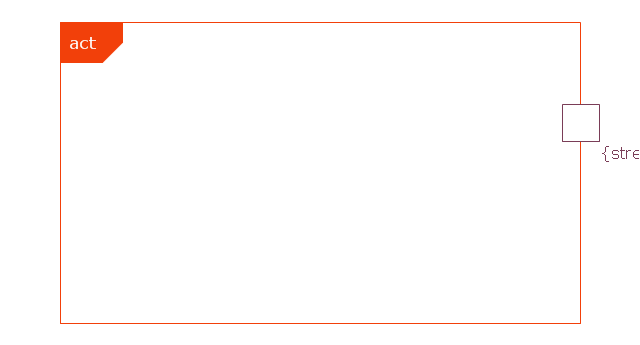
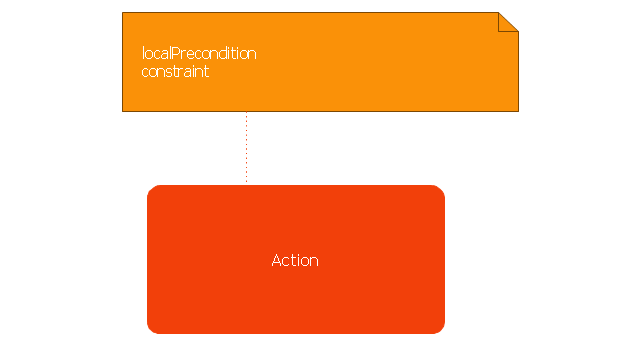
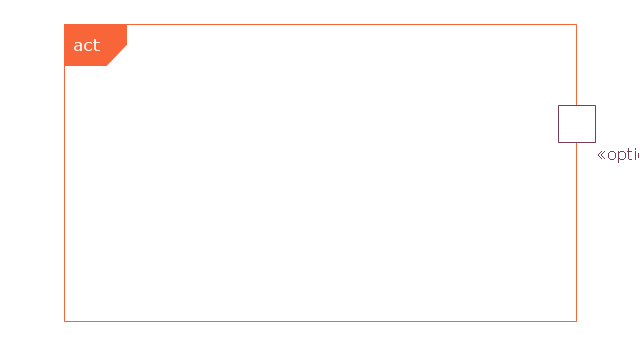
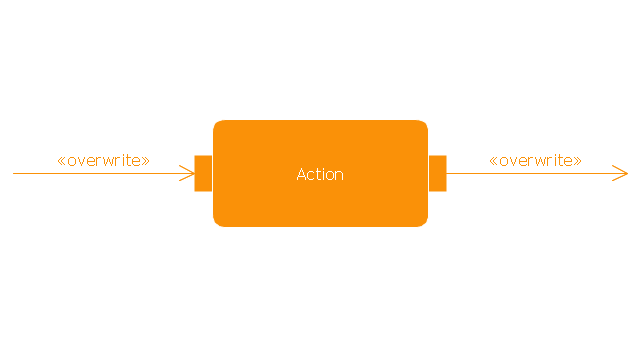
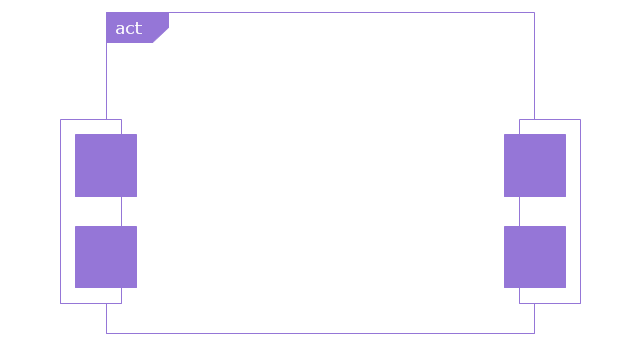
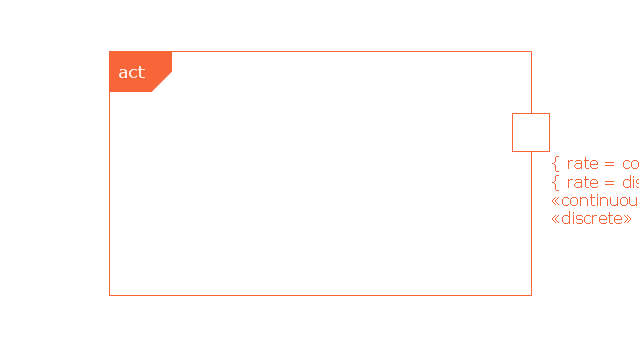
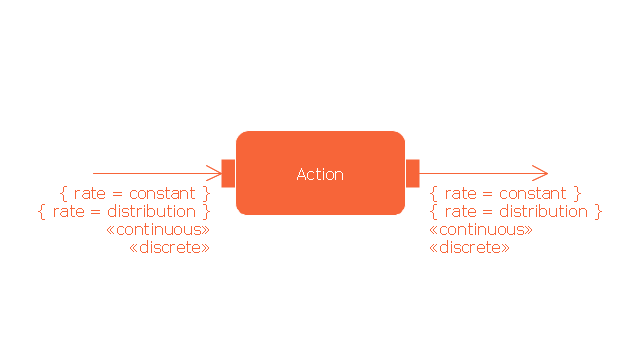
This vector stencils library contains 47 SysML activity diagram symbols.
Use it to design your SysML activity diagrams using ConceptDraw PRO diagramming and vector drawing software.
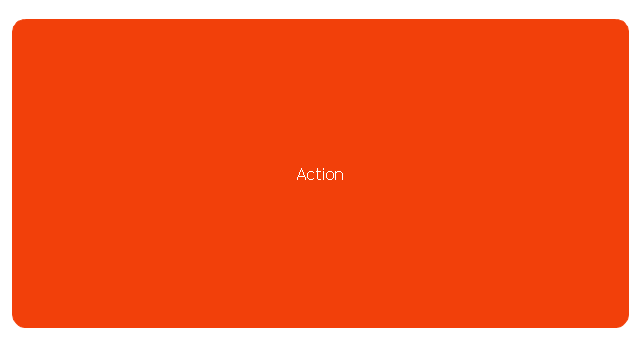
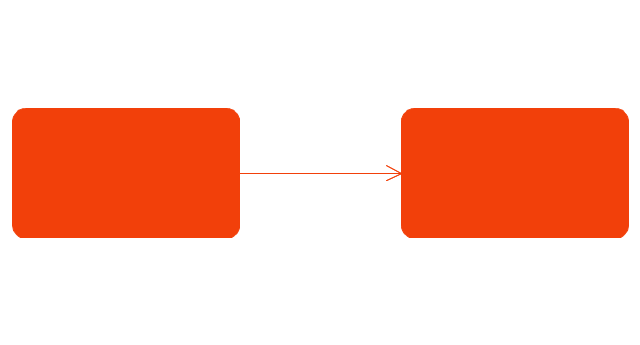
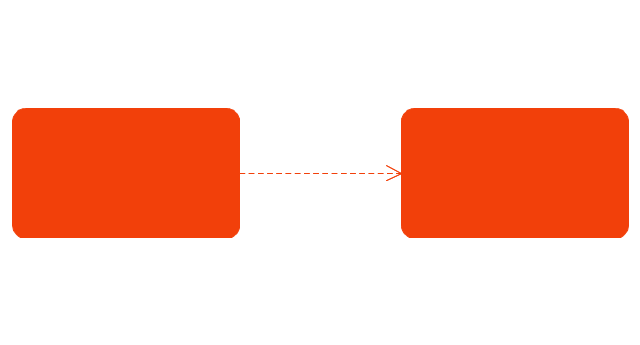
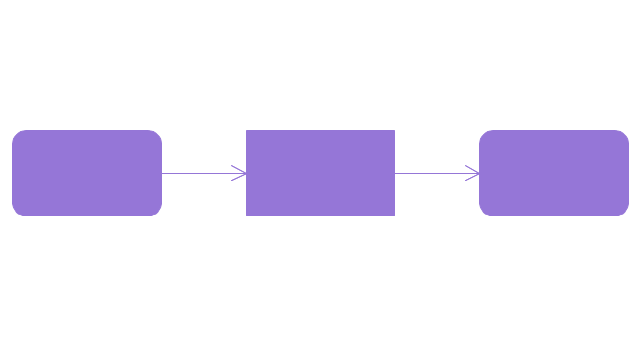
"Activity diagrams are constructed from a limited number of shapes, connected with arrows. The most important shape types:
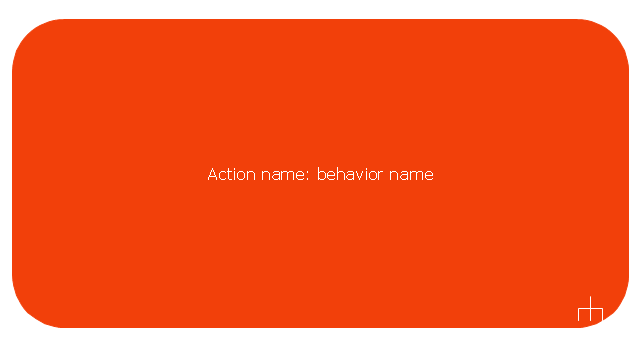
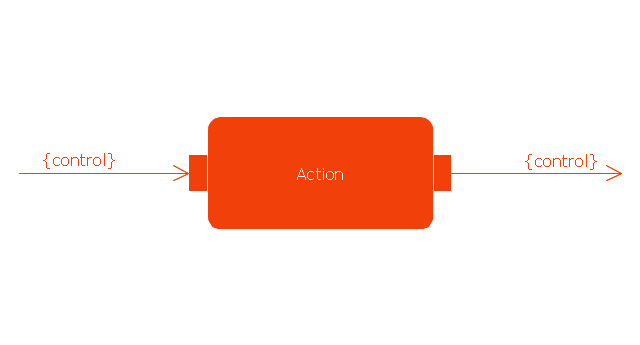
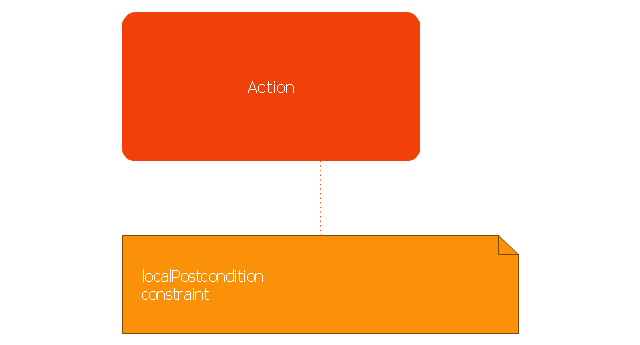
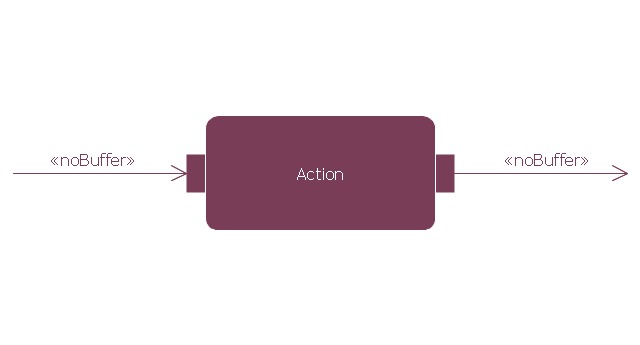
- rounded rectangles represent actions;
- diamonds represent decisions;
- bars represent the start (split) or end (join) of concurrent activities;
- a black circle represents the start (initial state) of the workflow;
- an encircled black circle represents the end (final state).
Arrows run from the start towards the end and represent the order in which activities happen." [Activity diagram. Wikipedia]
The vector stencils library "Activity diagram" is included in the SysML solution from the Software Development area of ConceptDraw Solution Park.
Use it to design your SysML activity diagrams using ConceptDraw PRO diagramming and vector drawing software.
"Activity diagrams are constructed from a limited number of shapes, connected with arrows. The most important shape types:
- rounded rectangles represent actions;
- diamonds represent decisions;
- bars represent the start (split) or end (join) of concurrent activities;
- a black circle represents the start (initial state) of the workflow;
- an encircled black circle represents the end (final state).
Arrows run from the start towards the end and represent the order in which activities happen." [Activity diagram. Wikipedia]
The vector stencils library "Activity diagram" is included in the SysML solution from the Software Development area of ConceptDraw Solution Park.
Action
Call behavior action
Accept event action

Accept time event action

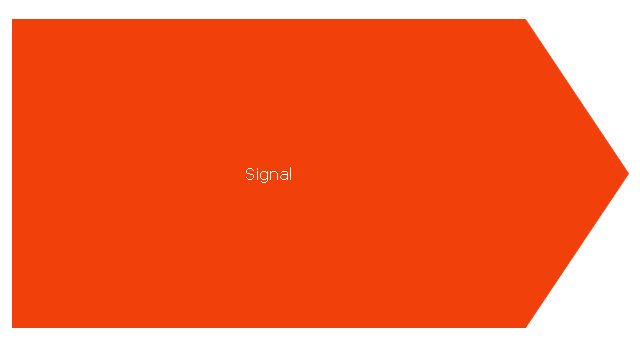
Send signal action
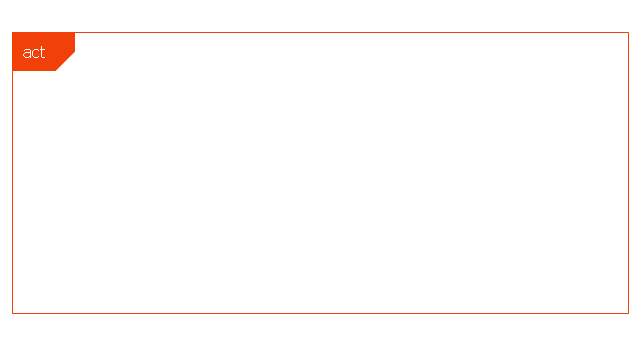
Activity
Activity final node
Flow final node
Activity parameter node
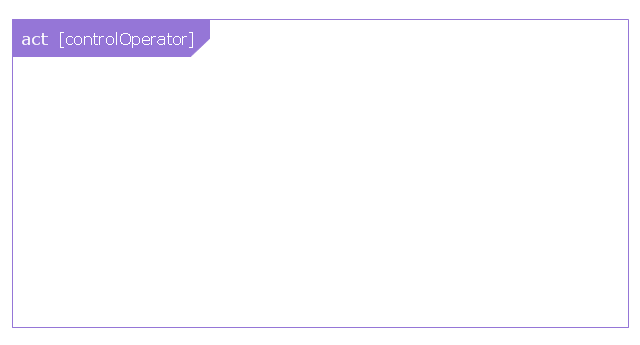
Control operator node
Control operator - frame
Decision/Merge node

Fork/Join node
Initial node
isControl
isStream
isStream 2
isStream 3
Local precondition
Local postcondition
NoBuffer
Object node
Object node 2
Optional
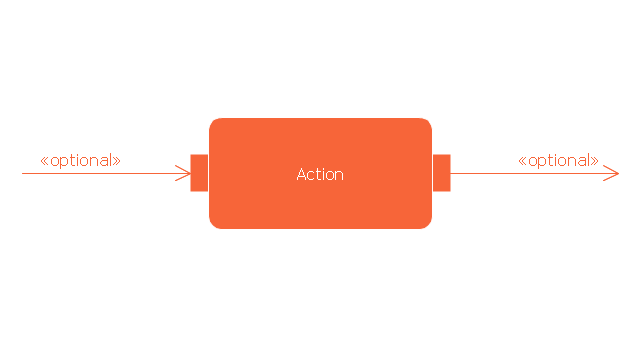
Optional 2
OverWrite
Parameter set
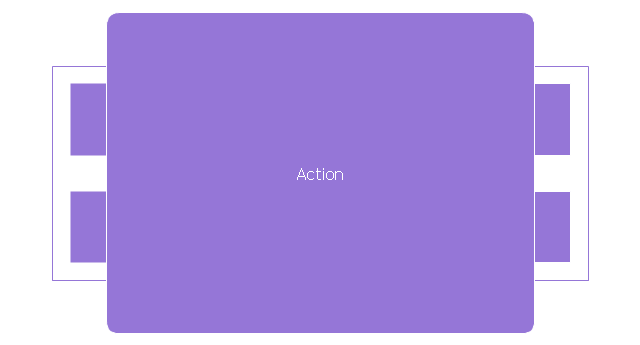
Parameter set 2
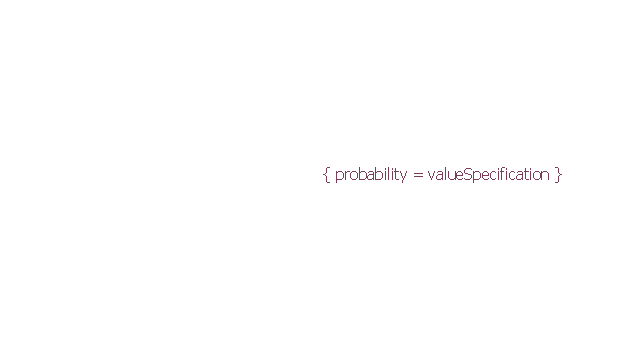
Probability
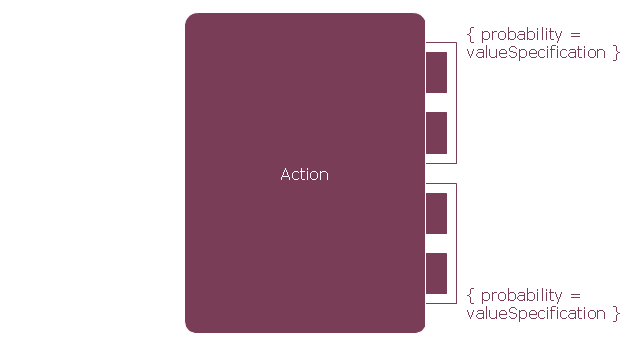
Probability 2
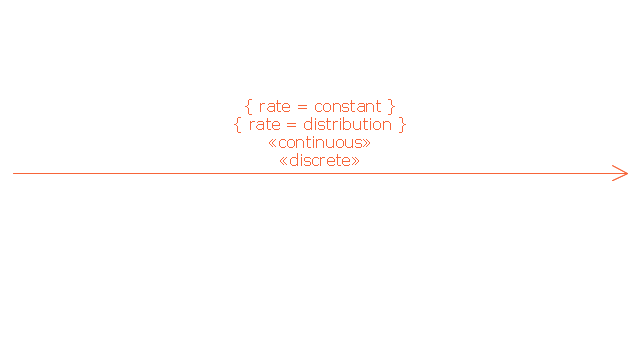
Rate
Rate 2
Rate 3
Rate 4
Rate 5
Rate 6
Control flow
Control flow 2
Object flow
Object flow 2
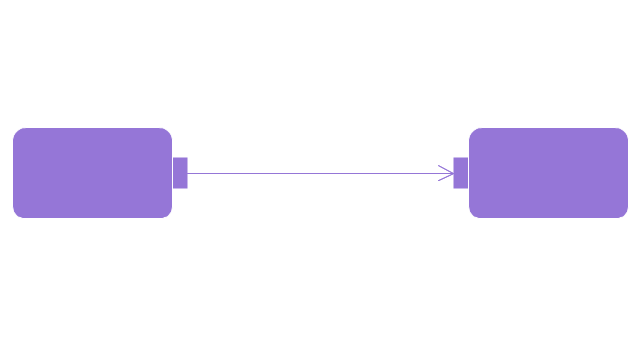
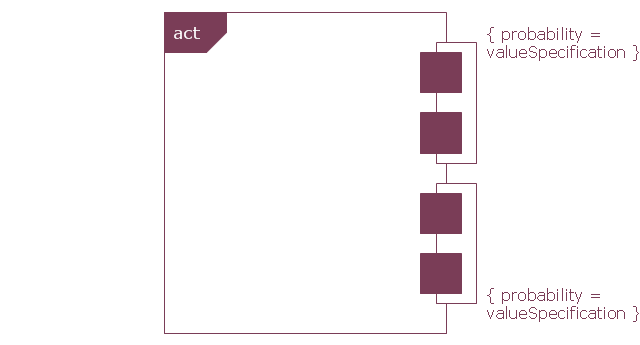
Probability path
Rate path
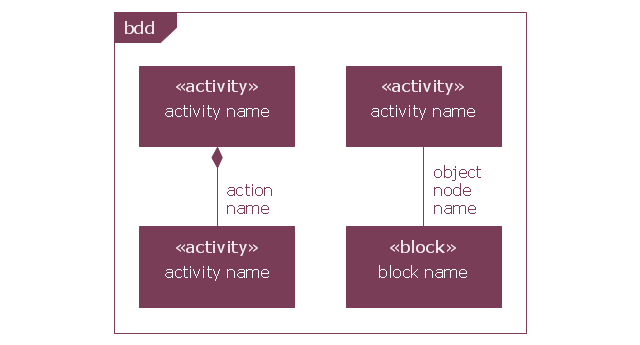
In block definition diagram, activity, association
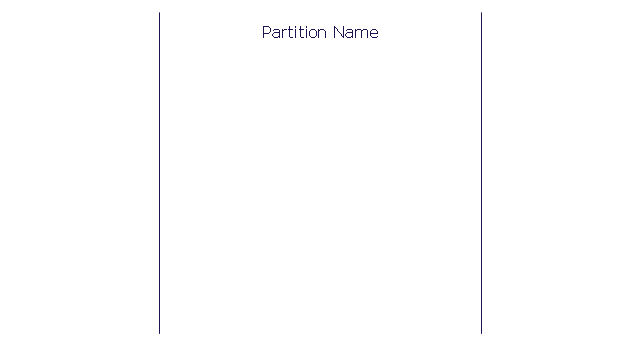
Activity partition
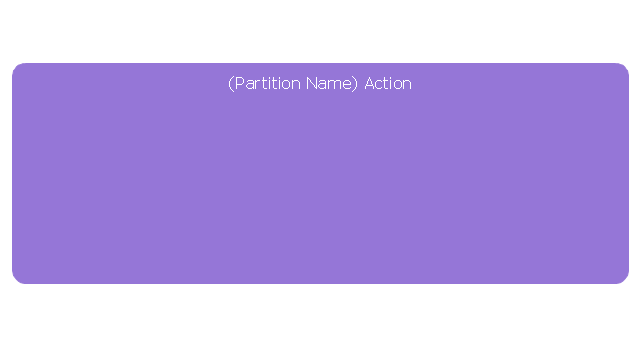
Activity partition - action
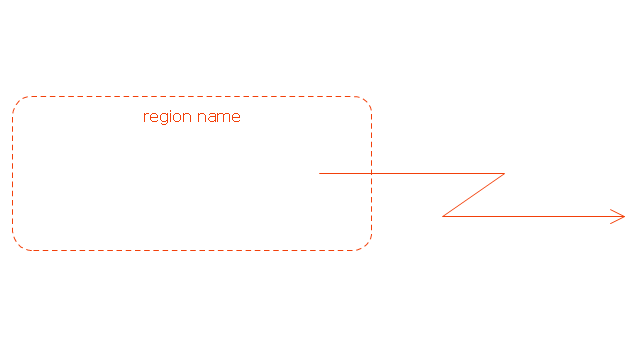
Interruptible activity region
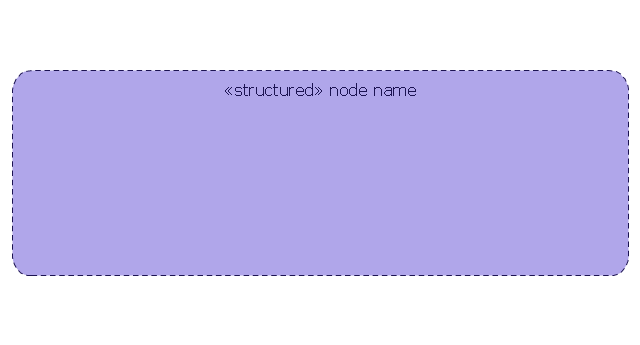
Structured activity node
Cisco Network Topology. Cisco icons, shapes, stencils and symbols

Any Cisco equipment on the network are named like node. Network diagram topology commonly designed within connected nodes. Cisco icons are worldwide acknowledged and mainly established as standard icons for network diagrams. You may use them loosely, but you may not rework them.
The Cisco Network Diagram shows how signals act on the networked devices, or how data routes on the network from one device to the other. There are number of physical network typologies that engineers use while constructing computer networks.
TQM Software — Build Professional TQM Diagrams

 Project Management Area
Project Management area provides Toolbox solutions to support solving issues related to planning, tracking, milestones, events, resource usage, and other typical project management functions.
 Fault Tree Analysis Diagrams
This solution extends ConceptDraw DIAGRAM.5 or later with templates, fault tree analysis example, samples and a library of vector design elements for drawing FTA diagrams (or negative analytical trees), cause and effect diagrams and fault tree diagrams.
- Probability Distribution
- Normal distribution graph - Template | Normal distribution | Normal ...
- Normal (Gaussian) distribution graph | Normal distribution graph ...
- Normal distribution | Interior Design Storage and Distribution ...
- Histogram - Template | Design elements - Histograms | Basic ...
- Interior Design Storage and Distribution - Design Elements ...
- Normal distribution graph - Template | Marketing Diagrams ...
- Histograms - Vector stencils library | Design elements - Histograms ...
- Design elements - Histogram | Histogram | How To Make Histogram ...
- Normal distribution graph - Template | Bell Curve Graph Template
- Design elements - Histogram
- Normal distribution graph - Template | Histogram example - Age of ...
- Frequency Distribution Dashboard | Design elements - Frequency ...
- Total Quality Management Value | Probability Quality Control Tools ...
- Making a Histogram | Histogram | Seven Basic Tools of Quality ...
- Probability Quality Control Tools | Definition TQM Diagram | Quality ...
- Probability Quality Control Tools | TQM Software — Build ...
- Interior Design Storage and Distribution - Design Elements ...
- Histograms | Histogram Chart | Basic Histograms | Histograms
- Basic Quality Check Tool
- ERD | Entity Relationship Diagrams, ERD Software for Mac and Win
- Flowchart | Basic Flowchart Symbols and Meaning
- Flowchart | Flowchart Design - Symbols, Shapes, Stencils and Icons
- Flowchart | Flow Chart Symbols
- Electrical | Electrical Drawing - Wiring and Circuits Schematics
- Flowchart | Common Flowchart Symbols
- Flowchart | Common Flowchart Symbols