PROBLEM ANALYSIS. Prioritization Matrix
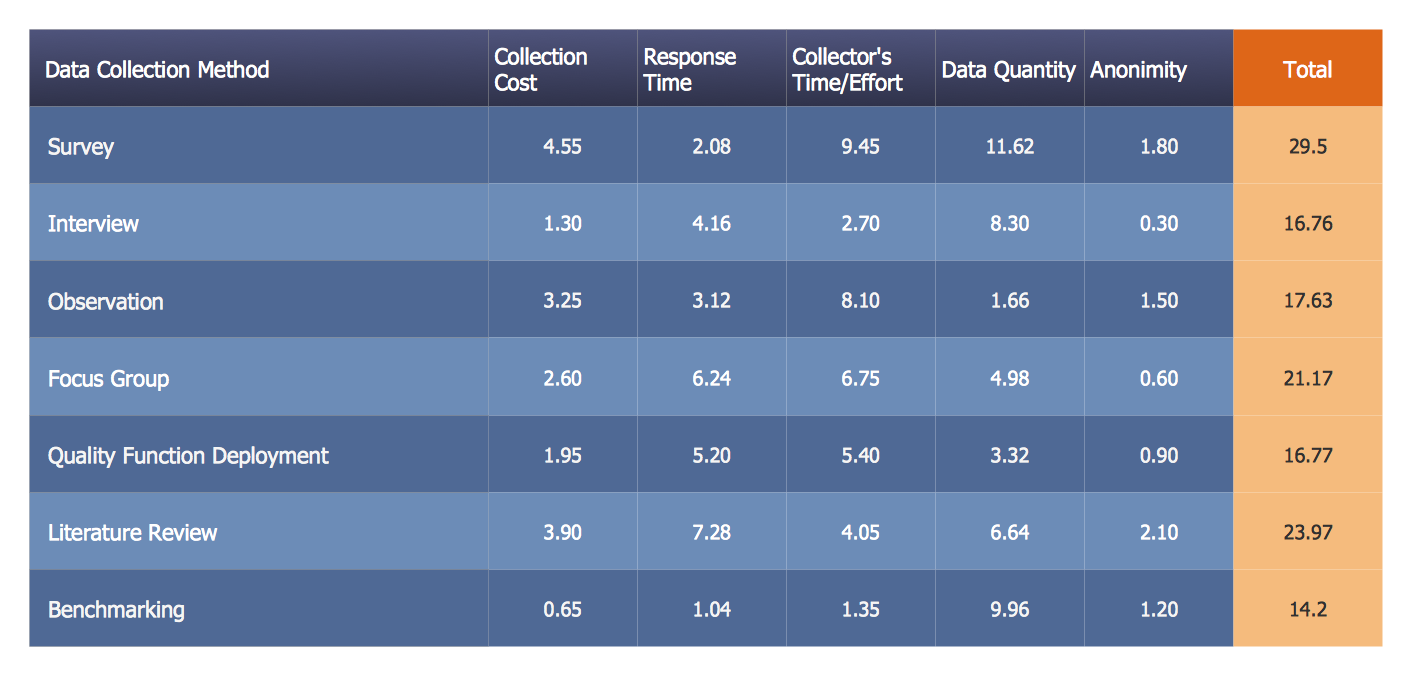
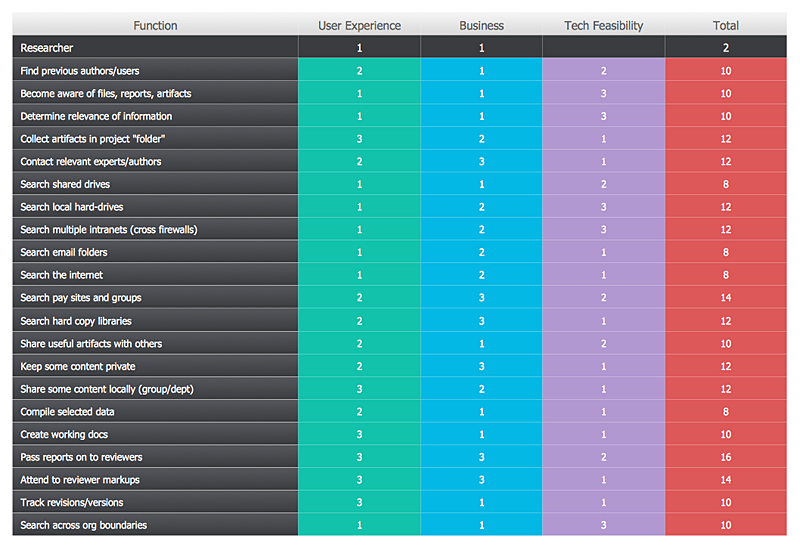
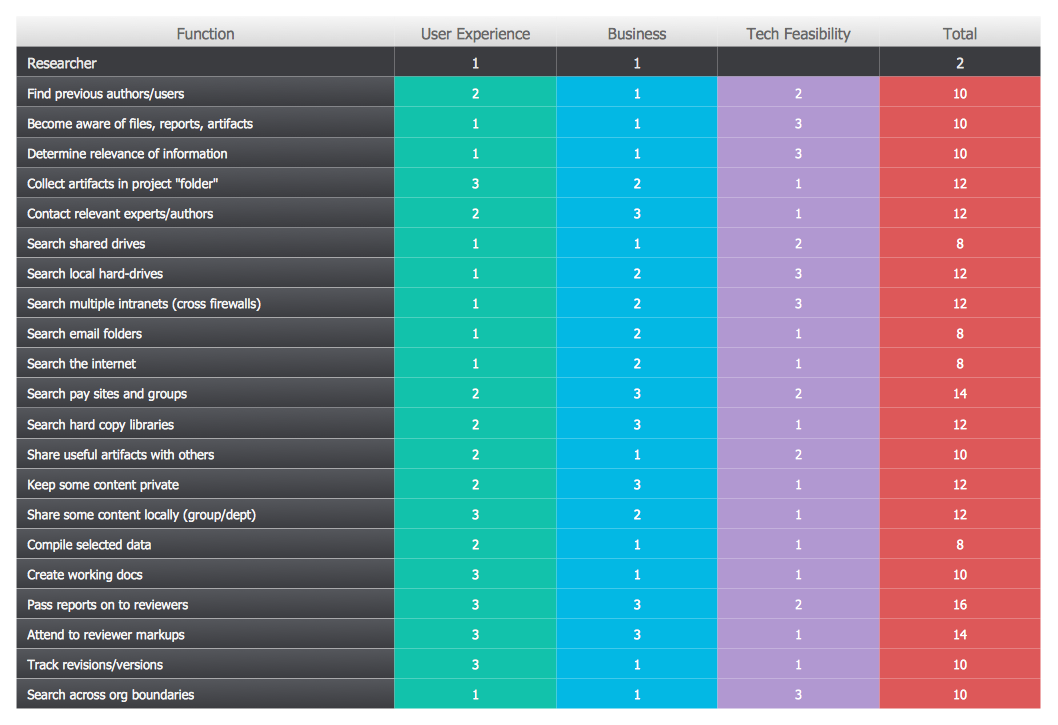
ConceptDraw OFFICE suite is a software for Prioritization Matrix diagram making. This diagram ranks the drivers’ factors to determine priority. It identifies the factors of the first priority for analysis of possible corrective actions. It assesses the weight of each factor for each criterion and specifies it in the Prioritization Matrix. The total sum of weights for a factor’s criteria indicates its priority.
Prioritization Matrix
You can design the Prioritization Matrix by hand on the paper, but we offer you the most easier way — to use the ConceptDraw DIAGRAM diagramming and vector drawing software extended with Seven Management and Planning Tools Solution from the Management Area.HelpDesk
How To Create a Prioritization Matrix
Making the prioritization matrix is helpful when all cannot be done at the same time. Prioritization matrix diagram shows the relationships between factors and this helps, to prioritize tasks and resources. This helps you to narrow down variants. By selecting and weighing options you can quickly determine the best choices and direct team to the best destinations. Prioritization matrix helps to identify the best way of implementing the most priority tasks. It is helpful in a case when you have limited resources. ConceptDraw solution for management and planning compiled from the Seven Management and Planning Tools provides the ability to quickly build Prioritization Matrix diagrams for your project using a special template.CORRECTIVE ACTIONS PLANNING. Involvement Matrix
The Involvement Matrix can identify the distribution of responsibilities and identify roles in a group or team. Use the Involvement Matrix to specify roles and responsibilities of actions in problem solving.ConceptDraw Office suite is a software for corrective actions planning.

Problem solving
Problem Solving - ConceptDraw OFFICT suite is a software for the problem solving. The Seven Management and Planning Tools solution is a set of such tools for investigating complex problems.These tools are exemplary at organizing research, parsing complex problems, providing a structure for the details, helping managers make decisions, and organizing effective communications in a visual manner that keeps everyone involved.

Cause and Effect Analysis
Cause and Effect Analysis - The Seven Management and Planning Tools is a tool for Cause and Effect Analysis that allows users to analyze the root causes for factors that influenced the problem. This diagram is constructed separately for each highly prioritized factor. The Diagram is then used for further formulation of potential actions.
Pyramid Diagram
Pyramid chart example is included in the Pyramid Diagrams solution from Marketing area of ConceptDraw Solution Park.Probability Quality Control Tools
The Total Quality Management Diagram solution helps your organization visualize business and industrial processes. Create Total Quality Management diagrams for business process with ConceptDraw software.Corrective Action Planning
One of the stages of the problem's solving process scenario is Corrective Action Planning.Corrective action planning define people and groups involvement in corrective actions by roles, identify logical sequences of scheduled actions and critical path of problem solving, identify possible risks of action plan and propose preventive actions.

HelpDesk
How to Manage Problem Solving Using Seven Management and Planning Tools
The Seven Management and Planning Tools solution can be used as an extension to the ConceptDraw DIAGRAM software enabling to create Affinity Diagrams, Relations Diagrams, Prioritization Matrices, Root Cause Analysis Tree Diagrams, Involvement Matrices, PERT Charts, and Risk Diagrams.
Organizational Charts with ConceptDraw DIAGRAM
With ConceptDraw DIAGRAM, you can quickly and easily create any type of orgchart professional. ConceptDraw DIAGRAM includes numerous organizational chart templates for the simple to complex multi-page charts.BCG Matrix
The growth–share matrix (BCG Matrix) was created by Bruce D. Henderson for the Boston Consulting Group in 1970 to help corporations to analyze their business units and to help the company allocate resources. How is it easy design the BCG Matrices in ConceptDraw DIAGRAM diagramming and vector drawing software supplied with unique Matrices Solution from the Marketing Area of ConceptDraw Solution Park.Root Cause Tree Diagram
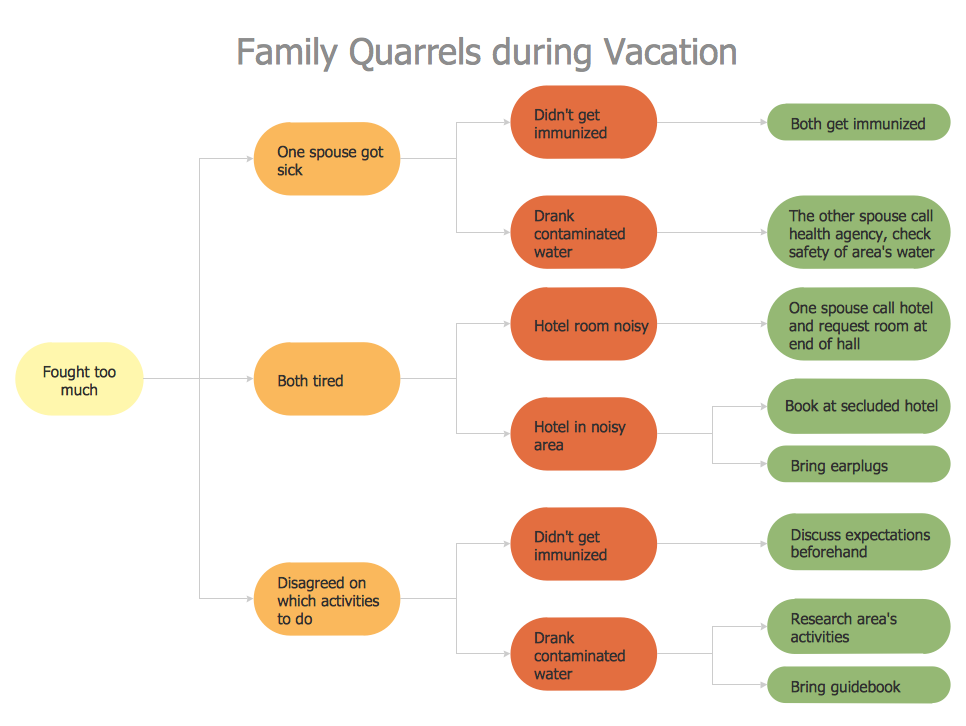
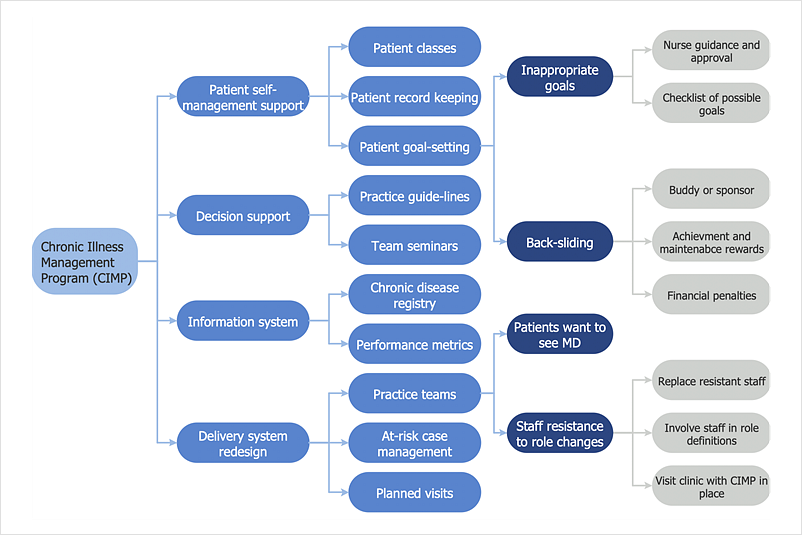
Analyze the root causes of factors that influence the problem. A diagram is constructed separately for each high priority factor. Identify the root causes for a factor and then propose possible corrective actions. The diagram displays the structure of causes for a factor and possible corrective actions. The Root Cause Analysis Tree Diagram is used for further formulation of actions.- PROBLEM ANALYSIS. Prioritization Matrix | How To Create a ...
- PROBLEM ANALYSIS. Prioritization Matrix | Authority Matrix ...
- How To Create a Prioritization Matrix | PROBLEM ANALYSIS ...
- SWOT Matrix Template | SWOT Analysis Solution - Strategy Tools ...
- Sales Strategy Priority Matrix
- PROBLEM ANALYSIS. Prioritization Matrix | SWOT Matrix Template ...
- PROBLEM ANALYSIS. Prioritization Matrix | Sales activity ...
- Prioritization matrix - Template | How To Create a Prioritization ...
- PROBLEM ANALYSIS. Prioritization Matrix
- PROBLEM ANALYSIS. Prioritization Matrix
- Authority Matrix Diagram Software | PROBLEM ANALYSIS ...
- PROBLEM ANALYSIS. Prioritization Matrix | Matrix Organization ...
- Cause and Effect Analysis - Fishbone Diagrams for Problem Solving ...
- PROBLEM ANALYSIS. Prioritization Matrix | Root Cause Analysis ...
- PROBLEM ANALYSIS. Prioritization Matrix | CORRECTIVE ...
- PROBLEM ANALYSIS. Prioritization Matrix | Prioritization Matrix ...
- Authority Matrix Diagram Software | Pyramid Diagram | PROBLEM ...
- CORRECTIVE ACTIONS PLANNING. Involvement Matrix ...
- SWOT Matrix Template | Authority Matrix Diagram Software ...
- Pyramid Diagram | Priority pyramid diagram | Pyramid Diagram ...
- ERD | Entity Relationship Diagrams, ERD Software for Mac and Win
- Flowchart | Basic Flowchart Symbols and Meaning
- Flowchart | Flowchart Design - Symbols, Shapes, Stencils and Icons
- Flowchart | Flow Chart Symbols
- Electrical | Electrical Drawing - Wiring and Circuits Schematics
- Flowchart | Common Flowchart Symbols
- Flowchart | Common Flowchart Symbols
