HelpDesk
How To Create a Prioritization Matrix

PROBLEM ANALYSIS. Prioritization Matrix


Prioritization Matrix

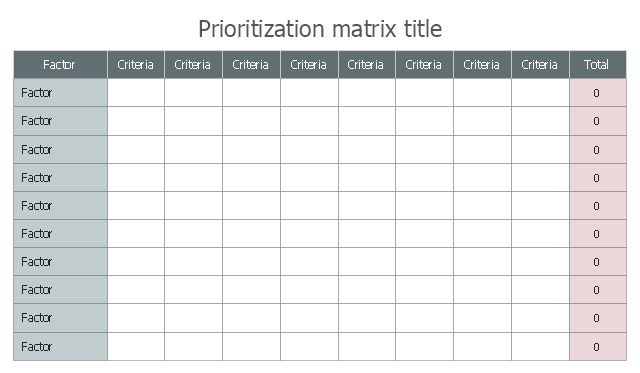
The prioritization matrix ranks factors. The process allows one to identify the factors that are the first priority. These factors can then be analyzed for possible corrective actions. The prioritization matrix allows for the weighting of each identified criterion.
"Prioritization Matrix.
This tool is used to prioritize items and describe them in terms of weighted criteria. It uses a combination of tree and matrix diagramming techniques to do a pair-wise evaluation of items and to narrow down options to the most desired or most effective. Popular applications for the Prioritization Matrix include Return-on-Investment (ROI) or Cost-Benefit analysis (Investment vs. Return), Time management Matrix (Urgency vs. Importance), etc." [Seven Management and Planning Tools. Wikipedia]
The prioritization matrix is one of the Seven Management and Planning Tools (7 MP tools, Seven New Quality Tools).
The prioritization matrix template for the ConceptDraw PRO diagramming and vector drawing software is included in the solution "Seven Management and Planning Tools" from the Management area of ConceptDraw Solution Park.
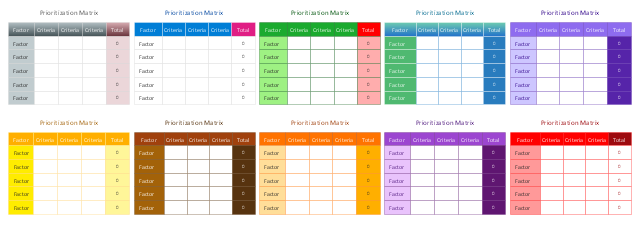
Prioritization matrix template
This vector stencils library contains 10 templates for drawing the prioritization matrices using the ConceptDraw PRO diagramming and vector drawing software.
The prioritization matrix is one of the Seven Management and Planning Tools (7 MP tools, Seven New Quality Tools).
"Prioritization Matrix ... is used to prioritize items and describe them in terms of weighted criteria. It uses a combination of tree and matrix diagramming techniques to do a pair-wise evaluation of items and to narrow down options to the most desired or most effective. Popular applications for the Prioritization Matrix include Return-on-Investment (ROI) or Cost-Benefit analysis (Investment vs. Return), Time management Matrix (Urgency vs. Importance), etc." [Seven Management and Planning Tools. Wikipedia]
Use prioritization matrix to rank items based on a set of criteria.
The example "Design elements - Prioritization matrix" is included in the solution "Seven Management and Planning Tools" from the Management area of ConceptDraw Solution Park.
Prioritization matrices
 Seven Management and Planning Tools
Seven Management and Planning Tools solution extends ConceptDraw DIAGRAM and ConceptDraw MINDMAP with features, templates, samples and libraries of vector stencils for drawing management mind maps and diagrams.
Matrix Organization Structure

Now we have ConceptDraw DIAGRAM diagramming and vector drawing software extended with 25 Typical Orgcharts solution from the Management area of ConceptDraw Solution Park which will help easy represent matrix organizational structure of any degree of complexity.
The Action Plan

ConceptDraw Office suite is a software for decision making and action plan.
TQM Diagram — Professional Total Quality Management

Probability Quality Control Tools

Root Cause Analysis

Analyze the root causes for factors that influenced the problem. This diagram is constructed separately for each highly prioritized factor. The goal of this is to find the root causes for the factor and list possible corrective action.
PDPC

CORRECTIVE ACTIONS PLANNING. Involvement Matrix

ConceptDraw Office suite is a software for corrective actions planning.
Internal Audit Process

ConceptDraw DIAGRAM diagramming and vector drawing software extended with Audit Flowcharts solution from the Finance and Accounting area perfectly suits for the Internal Audit Process. You can make sure this right now!
Cause and Effect Analysis

Management Tools — Total Quality Management

Corrective Action Planning

Corrective action planning define people and groups involvement in corrective actions by roles, identify logical sequences of scheduled actions and critical path of problem solving, identify possible risks of action plan and propose preventive actions.
How To create Value Stream Map (VSM)
 *")
HelpDesk
How to Manage Problem Solving Using Seven Management and Planning Tools

How Do Fishbone Diagrams Solve Manufacturing Problems

ConceptDraw DIAGRAM application extended with Fishbone Diagrams solution lets you construct Fishbone diagrams and represent globally recognized standards for manufacturing 6 Ms and 8 Ms.
- PROBLEM ANALYSIS. Prioritization Matrix | SWOT analysis ...
- Prioritization matrix - Template | How To Create a Prioritization ...
- SWOT Matrix Template | Prioritization matrix - Template | TOWS ...
- Prioritization matrix - Template
- Prioritization Matrix | Opportunity prioritization matrix | Sales activity ...
- PROBLEM ANALYSIS. Prioritization Matrix | SWOT Matrix Template ...
- Priority Matrix Template
- PROBLEM ANALYSIS. Prioritization Matrix | Prioritization Matrix ...
- Prioritization Matrix | Prioritization matrix - Template | Design ...
- SWOT Matrix Template | Prioritization Matrix | Design elements ...
- Opportunity prioritization matrix | New business opportunity SWOT ...
- Prioritization Matrix | PROBLEM ANALYSIS. Prioritization Matrix ...
- PROBLEM ANALYSIS. Prioritization Matrix | Prioritization matrix ...
- PROBLEM ANALYSIS. Prioritization Matrix | CORRECTIVE ...
- PERT chart - Template | PROBLEM ANALYSIS. Prioritization Matrix ...
- How To Create a Prioritization Matrix | Prioritization Matrix ...
- The Action Plan | Corrective Action Planning | PROBLEM ANALYSIS ...
- PROBLEM ANALYSIS. Prioritization Matrix | Matrix Organization ...
- Prioritization matrix - Health care problems | Seven Management ...
- Decision matrix | Prioritization Matrix | How To Create a Prioritization ...
- ERD | Entity Relationship Diagrams, ERD Software for Mac and Win
- Flowchart | Basic Flowchart Symbols and Meaning
- Flowchart | Flowchart Design - Symbols, Shapes, Stencils and Icons
- Flowchart | Flow Chart Symbols
- Electrical | Electrical Drawing - Wiring and Circuits Schematics
- Flowchart | Common Flowchart Symbols
- Flowchart | Common Flowchart Symbols