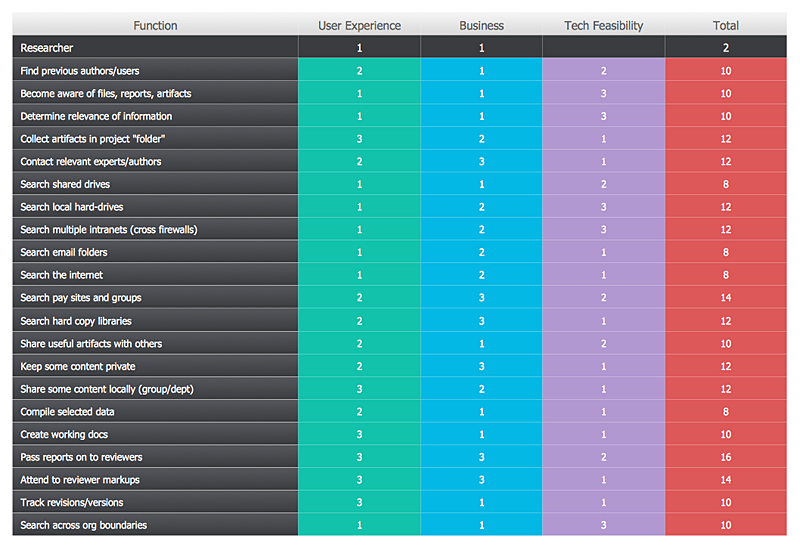
Prioritization Matrix

PROBLEM ANALYSIS. Prioritization Matrix


Pyramid Chart Maker

HelpDesk
How To Create a Prioritization Matrix
Structured Systems Analysis and Design Method. SSADM with ConceptDraw DIAGRAM

- Prioritisation Chart
- Prioritizing Tasks Chart
- Prioritization Matrix | PROBLEM ANALYSIS. Prioritization Matrix ...
- PROBLEM ANALYSIS. Prioritization Matrix | SWOT analysis ...
- PROBLEM ANALYSIS. Prioritization Matrix | Pyramid Diagram ...
- Prioritization matrix - Template | How To Create a Prioritization ...
- PROBLEM ANALYSIS. Prioritization Matrix | Prioritisation Icon
- Prioritizing Chart
- Prioritization matrix - Health care problems | Seven Management ...
- PROBLEM ANALYSIS. Prioritization Matrix | Root Cause Analysis ...
- ERD | Entity Relationship Diagrams, ERD Software for Mac and Win
- Flowchart | Basic Flowchart Symbols and Meaning
- Flowchart | Flowchart Design - Symbols, Shapes, Stencils and Icons
- Flowchart | Flow Chart Symbols
- Electrical | Electrical Drawing - Wiring and Circuits Schematics
- Flowchart | Common Flowchart Symbols
- Flowchart | Common Flowchart Symbols