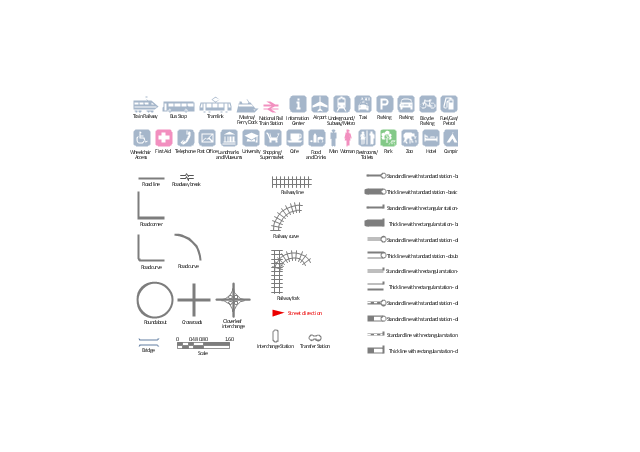
The vector stencils library "Transport map" contains 96 signs and pictograms for drawing road and transit maps.
"A transit map is a topological map in the form of a schematic diagram used to illustrate the routes and stations within a public transport system - whether this be bus lines, tramways, rapid transit, commuter rail or ferry routes. The main components are color coded lines to indicate each line or service, with named icons to indicate stations or stops.
Transit maps can be found in the transit vehicles, at the platforms or in printed timetables. Their primary function is to help users to efficiently use the public transport system, including which stations function as interchange between lines. Unlike conventional maps, transit maps are usually not geographically accurate - instead they use straight lines and fixed angles, and often illustrate a fixed distance between stations, compressing those in the outer area of the system and expanding those close to the center." [Transit map. Wikipedia]
The pictograms example "Design elements - Transport map" was created using the ConceptDraw PRO diagramming and vector drawing software extended with the Spatial Infographics solution from the Maps area of ConceptDraw Solution Park.
Transport map pictograms
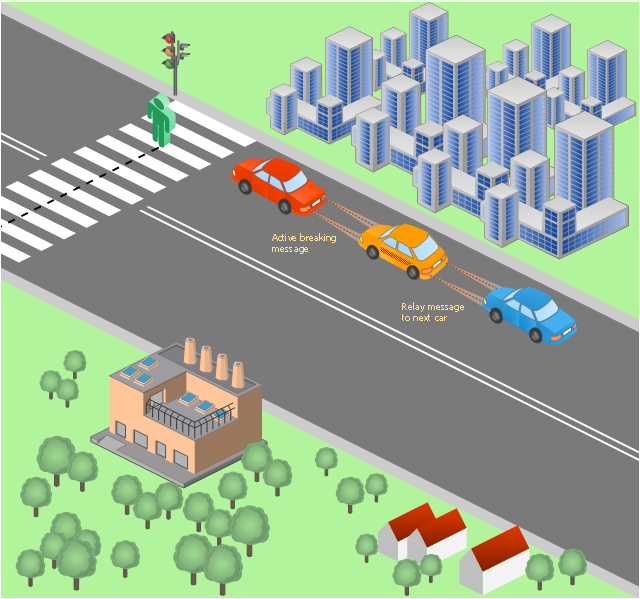
This vehicular network diagram example was drawn on the base of picture illustrating the post "LED Traffic Signals and Vehicle Lights for Optical Broadband Communications" from the blog "Terranautix".
"Visible Light Communication (VLC) is a rapidly emerging field that focuses on the use of light sources (between 400 THz and 800 THz) for the primary purpose of broadband communications. In order to transmit data over light, the light source (transceiver) is pulsed on and off rapidly to create a data stream, similar to fiber optic communications, but in the wireless form, or “Free-Space Optical Transmission“. By pulsing lights many thousands (and millions) of times per second, data transmission occurs at a rate undetectable by the human eye. Optical receivers convert the light pulses to an electronic signal on the receiver end. The Light Emitting Diode (LED) is the primary form factor currently undergoing extensive research."
[terranautix.com/ tag/ communications]
The vehicular network diagram example "Visible light communication" was created using the ConceptDraw PRO diagramming and vector drawing software extended with the Vehicular Networking solution from the Computer and Networks area of ConceptDraw Solution Park.
Vehicular network diagram
This example was created on the base of the Georgia DOT Performance Management Dashboard from the Georgia Department of Transportation website.
[dot.ga.gov/ informationcenter/ statistics/ performance/ Pages/ default.aspx]
"Performance management (PM) includes activities which ensure that goals are consistently being met in an effective and efficient manner. Performance management can focus on the performance of an organization, a department, employee, or even the processes to build a product of service, as well as many other areas.
PM is also known as a process by which organizations align their resources, systems and employees to strategic objectives and priorities.
Performance management originated as a broad term coined by Dr. Aubrey Daniels in the late 1970s to describe a technology (i.e. science imbedded in applications methods) for managing both behavior and results, two critical elements of what is known as performance. A formal definition of performance management, according to Daniels' is "a scientifically based, data-oriented management system. It consists of three primary elements-measurement, feedback and positive reinforcement."" [Performance management. Wikipedia]
The meter dashboard example "Georgia DOT Performance Management" was created using the ConceptDraw PRO diagramming and vector drawing software extended with the Meter Dashboard solution from the area "What is a Dashboard" of ConceptDraw Solution Park.
Meter dashboard

- Rail vehicle examples | Rail transport - Vector stencils library ...
- Aerospace and Transport | Rail vehicle examples | Truck vehicle ...
- Aerospace and Transport | Transport map - Template | Metro Map ...
- UML Class Diagram Example for Transport System
- Aerospace and Transport | UML Class Diagram Example for ...
- Aerospace and Transport | Road Transport - Design Elements ...
- Illustration | Aerospace and Transport | Truck vehicle clipart ...
- Truck vehicle clipart | Aerospace and Transport | Road Transport ...
- Examples Of Rail Transport
- Aerospace and Transport | Truck vehicle clipart | Illustration Area ...
- Rail transport - Design elements | Design elements - Rail transport ...
- Aerospace and Transport | Truck vehicle clipart | Design elements ...
- How to draw Metro Map style infographics? (Los Angeles ...
- Industrial vehicles - Vector stencils library | Industrial transport ...
- Industrial transport - Design elements | Road Transport - Design ...
- Brilliant Examples of Infographics Map, Transport , Road | Aerospace ...
- Benefits and cons of car leasing - Presentation slide | Road transport ...
- Aerospace and Transport | Truck vehicle clipart | Design elements ...
- Truck vehicle clipart | Design elements - Industrial vehicles ...
- Aerospace vehicle examples | Truck vehicle clipart | Rail vehicle ...
- ERD | Entity Relationship Diagrams, ERD Software for Mac and Win
- Flowchart | Basic Flowchart Symbols and Meaning
- Flowchart | Flowchart Design - Symbols, Shapes, Stencils and Icons
- Flowchart | Flow Chart Symbols
- Electrical | Electrical Drawing - Wiring and Circuits Schematics
- Flowchart | Common Flowchart Symbols
- Flowchart | Common Flowchart Symbols