This site uses cookies. By continuing to browse the ConceptDraw site you are agreeing to our Use of Site Cookies.

Target Diagram

Target Diagram is a convenient and visual way of presentation information which is popular and widely used in marketing, business and economics. ConceptDraw DIAGRAM diagramming and vector drawing software extended with Target and Circular Diagrams solution from the Marketing area of ConceptDraw Solution Park is ideal for fast and easy drawing a Target Diagram.

Entity-Relationship Diagram

Entity Relationship Diagram (ERD) is the world-known way to show the logical structure of databases in visual manner. The best software tool for drawing Entity-Relationship Diagram is ConceptDraw DIAGRAM vector graphics software with Entity-Relationship Diagram (ERD) solution from Software Development area which gives the ability to describe a database using the Entity-Relationship model. The vector graphic diagrams produced using this solution can be successfully used in whitepapers, presentations, datasheets, posters, or any technical materials.

Flowchart design. Flowchart symbols, shapes, stencils and icons

A flowchart is a type of diagram that represents an algorithm, workflow or process, showing the steps as boxes of various kinds - flowchart symbols, and their order by connecting them with arrows.
Mavericks have always desired to stand apart and gorgeous design is the recipe for that. Any business graphic document will be more understandable if will use an expository color scheme for their parts. Flowchart design makes versatile presenting and explaining of the process and gives a fresh view that distinguishes it from black and white flowcharts on a paper. Workflow diagram or process flow diagrams become more understandable to ordinary people when it use minimum symbols and special signs.
The best design can be accomplished by starting from any of the suitable Conceptdraw examples. Pick one of them and begin to input proper text into each Flowchart symbols and shapes. Apply less colors in the document and don't turn into rainbow your diagram, three or four will be enough, also note that business process flowchart may not contain bright color hues. The next clue is to use identical colors for same flowchart shape types.
Business Process Modeling with ConceptDraw
Business Process Modeling with ConceptDraw "Business Process Diagrams" Solution

Cafe Design

Cafes and restaurants are the places for relax and recreation, so the most important is their design and atmosphere of comfort, harmony, and uniqueness. So Cafe Design requires great creativity and efforts from the designers. ConceptDraw DIAGRAM software extended with Cafe and Restaurant Floor Plan solution from the Building Plans area of ConceptDraw Solution Park is the most simple way of displaying your Cafe Design ideas and plans first on the computer screen, and then on the paper.

Influence Diagram

This sample shows the Influence Diagram. It was created in ConceptDraw DIAGRAM diagramming and vector drawing software using the Basic Diagramming Solution from the Universal Diagramming area of ConceptDraw Solution Park.
Influence diagram represents the directed acyclic graph with three types of nodes and three types of arcs that connect the nodes. Decision node is drawn as a rectangle, Uncertainty node is drawn as an oval, Value node is drawn as an octagon.

SysML

Systems Modeling Language (SysML) is a general-purpose modeling language for systems engineering applications.
ConceptDraw DIAGRAM diagramming and vector drawing software was extended with SysML Solution from the Software Development Area of ConceptDraw Solution Park specially to help systems engineers design various model systems with SysML.

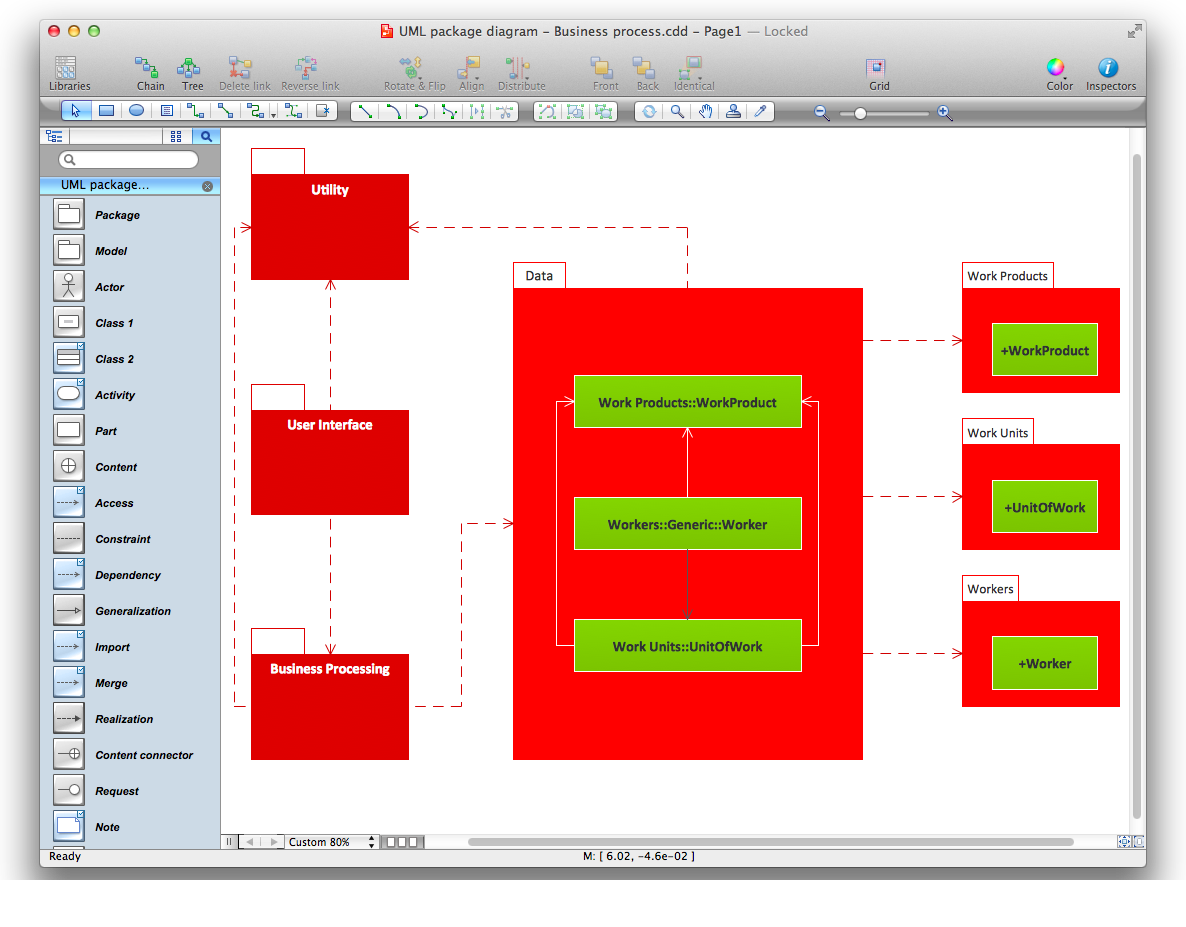
Diagramming Software for Design UML Package Diagrams

UML Package Diagram illustrates the functionality of a software system.

Business Process Flowchart Symbols

The business process flowchart symbols used for business process mapping are predefined by Business Process Modeling Notation (BPMN) and actually have their roots in the data processing diagrams and programming flow charts. Business Process flowchart symbols provide drawing business process flowcharts, diagrams and maps of any complexity.

Types of Flowcharts

A Flowchart is a graphically representation of the process, algorithm or the step-by-step solution of the problem. There are ten types of Flowcharts. Using the Flowcharts solution from the Diagrams area of ConceptDraw Solution Park you can easy and quickly design the Flowchart of any of these types.
How to Simplify Flow Charting

Examples of Flowcharts, Org Charts and More

ConceptDraw examples covers a broad spectrum of business graphics categories. We separated all the graphic documents on application areas and had produced multiple solutions for each of them. ConceptDraw provides a wide variety of examples such as flowcharts, organizational charts, business charts, UML diagrams, database and ERD, directional map, network diagrams and lots more. Each solution accommodates 10+ examples that shows specific application cases of a diagram. ConceptDraw STORE is an application for downloading solutions with examples, templates and stencil libraries. Please choose any examples you are interested in, alternatively download them for free; you will need to install ConceptDraw to view them. As you will see, ConceptDraw is very powerful, you can use more than 10000 symbols, examples, and many pre-drawn templates, to create your own spectacular flowcharts, business diagrams, network diagrams and lots more, effortlessly, and in no time at all.
What is ConceptDraw OFFICE