HelpDesk
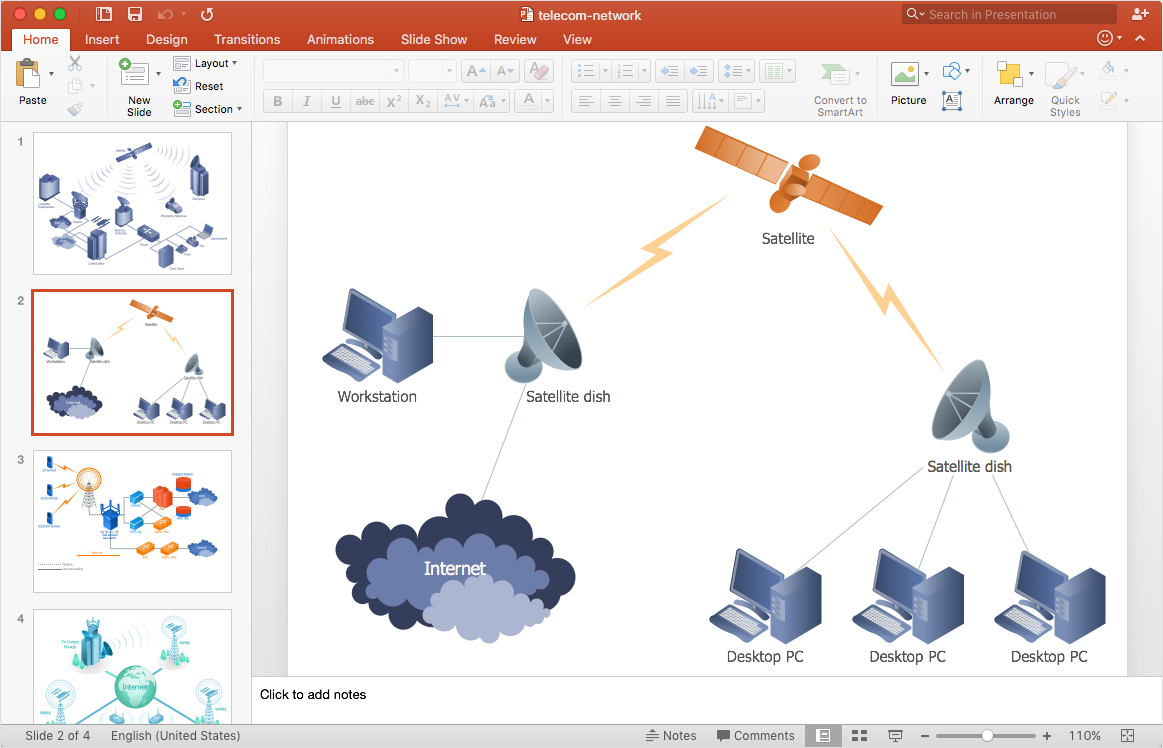
How to Add a Telecommunication Network Diagram to a PowerPoint Presentation
Telecommunication network diagram represents a system consisting of computers, servers, telecommunication devices, switches, satellites, wireless transmitters, antennas, cables, etc., that link a set of remote nodes. It also describes a telephone exchange, that connects calls between landlines. ConceptDraw DIAGRAM allows you to easily create telecommunication network diagrams and then make a PowerPoint Presentation from your network documentation in a few clicks. Telecommunication network diagrams are used to show components and connections in a telecommunications network: how they are interacted between each other and with end-users. The PowerPoint presentation on the concept of telecom network can be very informative and helpful. ConceptDraw DIAGRAM allows you to make an MS PowerPoint Presentation from your telecommunication network diagrams in a few clicks.HelpDesk
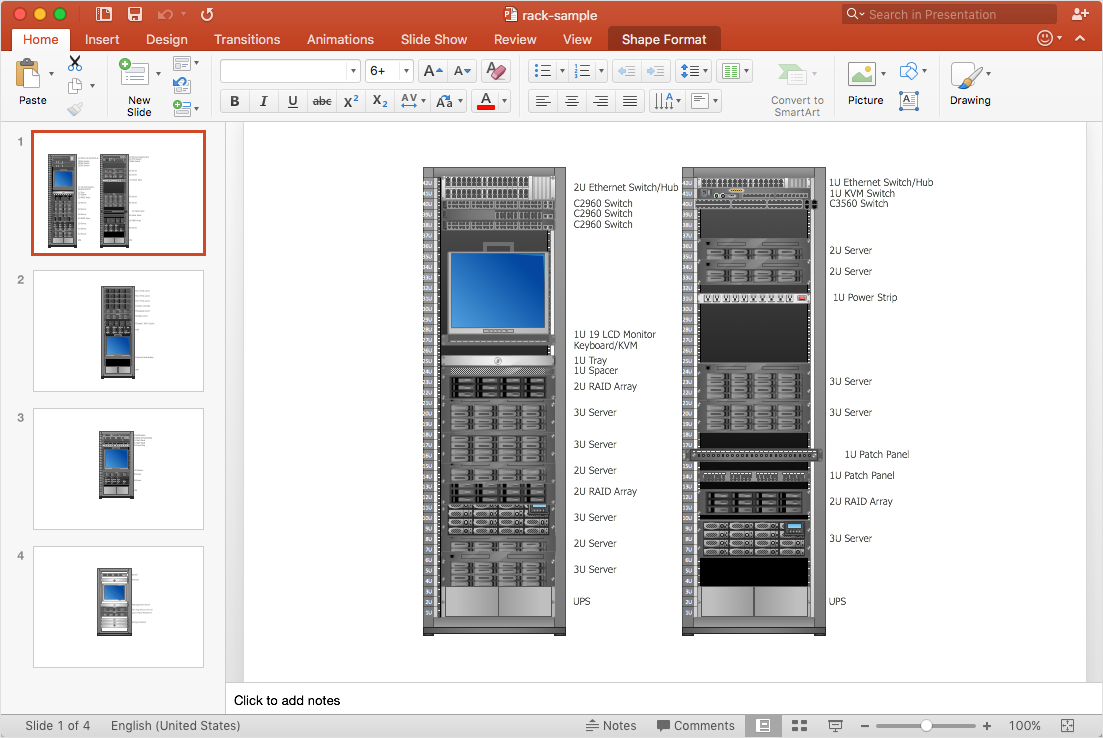
How to Add a Rack Diagram to a PowerPoint Presentation
Rack diagrams are created to make short work of configuring and documenting the server and network equipment of the rack frameworks. Rack diagrams may be useful when considering equipment purchasing or installing. Using the ConceptDraw Rack Diagrams solution, you can quickly and easily design a rack diagram from the set of vector graphics objects that are fully consistent with accepted industry standards. The Rack diagram will help you when considering and purchasing a rack of network equipment. When installing equipment, a rack diagram will help you to situate equipment quickly and in a due manner.The PowerPoint presentation on the concept of your server room rack layouts can be very informative and helpful. ConceptDraw DIAGRAM allows you to easily create wireless network diagrams and then make a PowerPoint Presentation from your diagrams in a single click.
HelpDesk
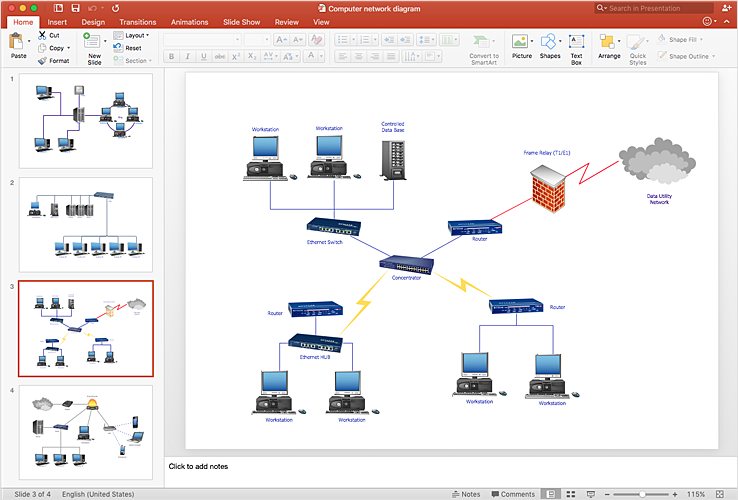
How To Add a Computer Network Diagram to a PowerPoint Presentation
The PowerPoint presentation of the computer network can be very informative. ConceptDraw DIAGRAM allows you to easily create computer network diagrams and then make a PowerPoint Presentation from your network diagrams in a single click.Dashboard
ConceptDraw DIAGRAM extended with Sales Dashboard solution from the Marketing area of ConceptDraw Solution Park is a perfect software for creating the live dashboard for the business data and progress visualization.HelpDesk
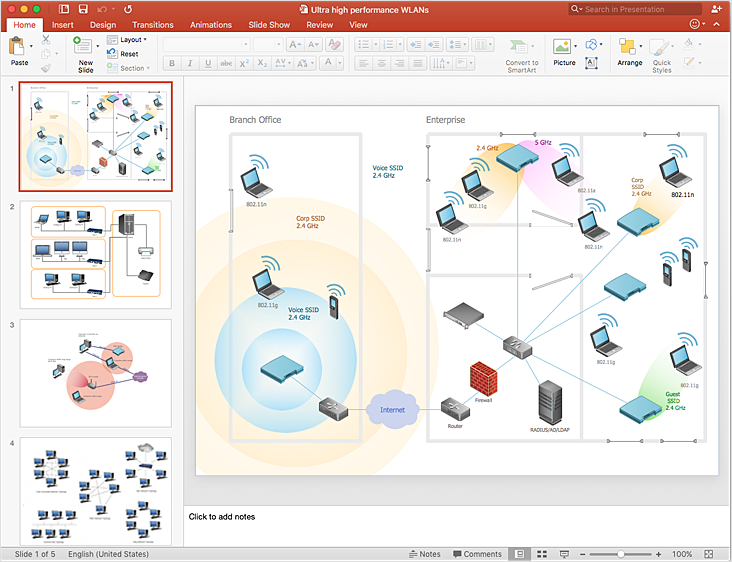
How to Add a Wireless Network Diagram to a PowerPoint Presentation
The PowerPoint presentation of a wireless network can be very informative. ConceptDraw DIAGRAM allows you to easily create wireless network diagrams and then make a PowerPoint Presentation from your diagrams in a single click.HelpDesk
How to Use ConceptDraw Sales Dashboard Solution
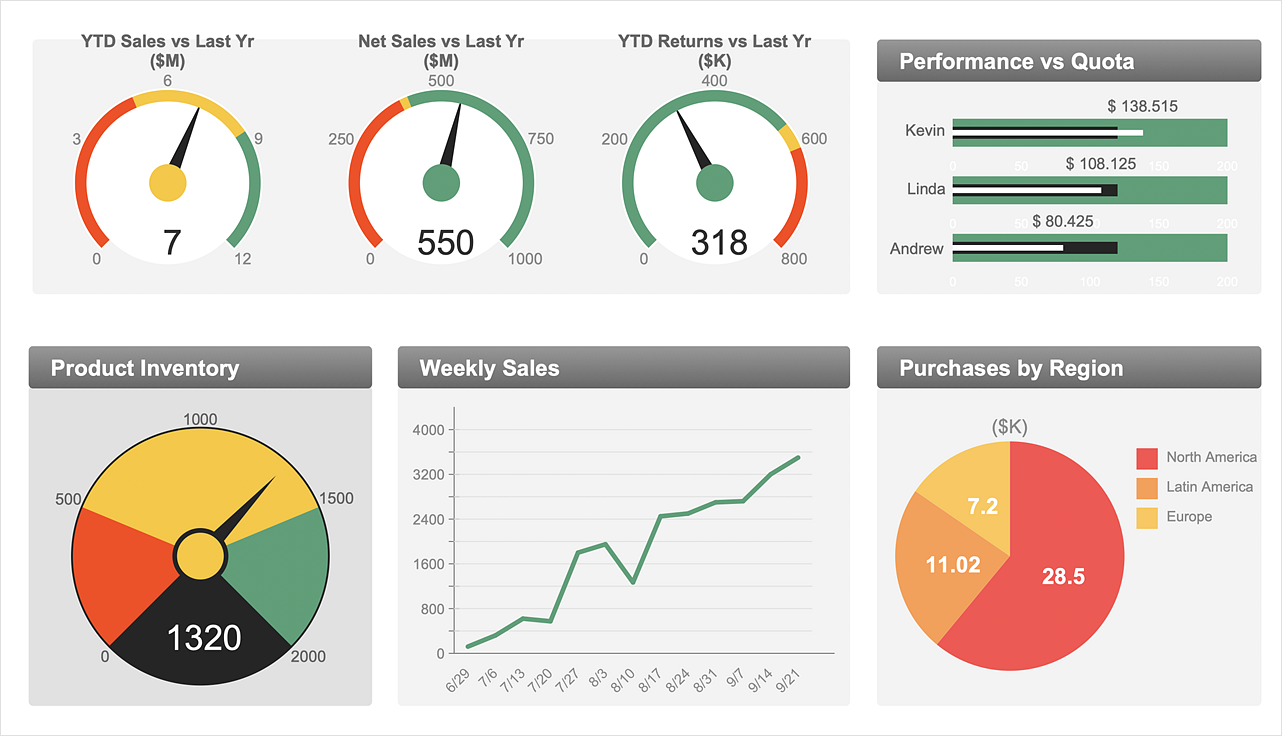
An interactive visual dashboard is a valuable tool for any sales team. Sales dashboard allows you to view and monitor sales indicators that are important for manager and sales staff. It helps to use timely and reliable information to improve the quality of sales performance and increase sales revenues. ConceptDraw Sales Dashboard solution is a tool for both: sales manager and sales team. It provides the visualization of key performance indicators that are critical to the entire sales organization. The custom sales dashboard displays real-time information on sales performance KPIs with the help of intuitive and easy-to-understand diagrams and charts. Sales Dashboard helps the entire team see where they are, and what needs to be done. With ConceptDraw DIAGRAM you can easily create a visual Sales Dashboard using Live Objects Technology.
 Sales Dashboard
Sales Dashboard solution extends ConceptDraw DIAGRAM software with templates, samples and library of vector stencils for drawing the visual dashboards of sale metrics and key performance indicators (KPI).
Sales Dashboard
Sales Dashboard is a useful and visual way of representing sales performances, tracking and analyzing sales. It gives a clear picture about the business development success and sales growth progress.ConceptDraw DIAGRAM software extended with Sales Dashboard solution from the Marketing area of ConceptDraw Solution Park is effective for visualizing sales data, all set of KPIs on the Sales Dashboard with purpose to see how your business develops and to make conclusions for improvement the sales.
HelpDesk
How to Use ConceptDraw Dashboard for Facebook on Mac
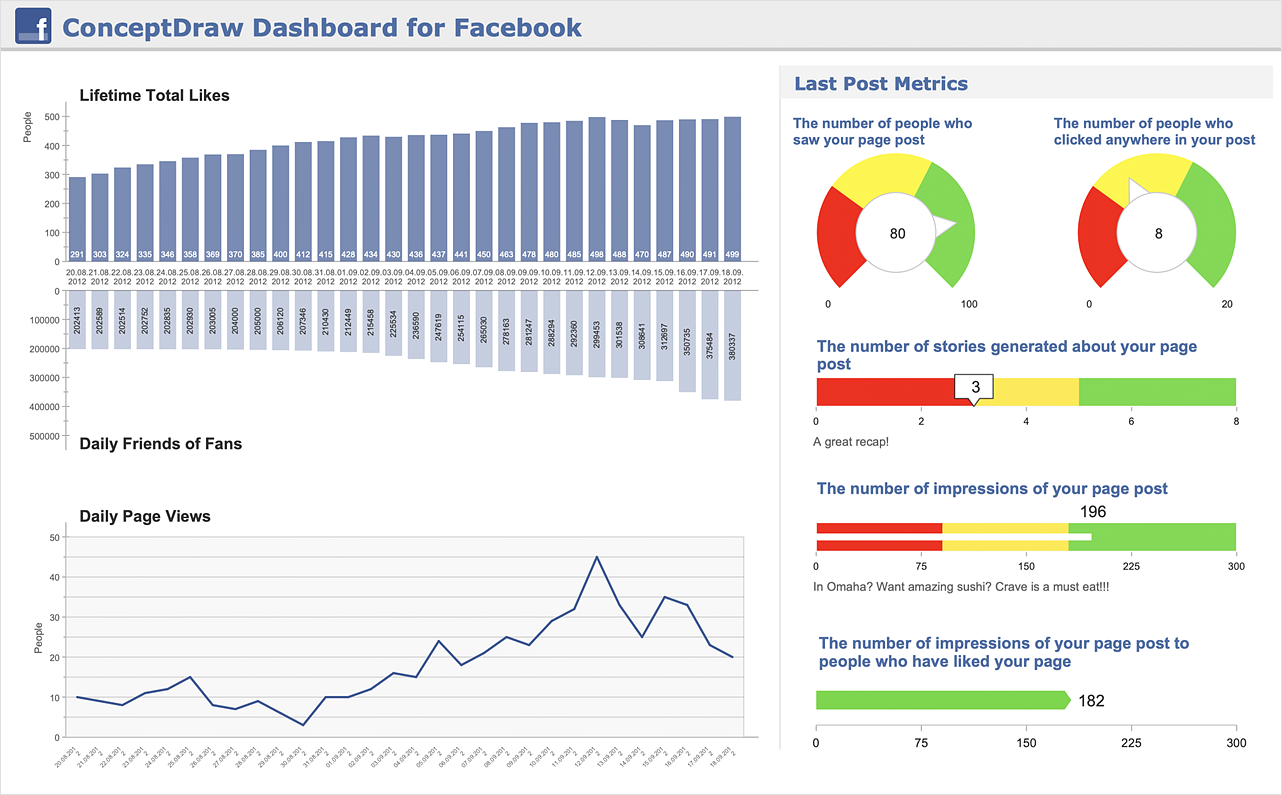
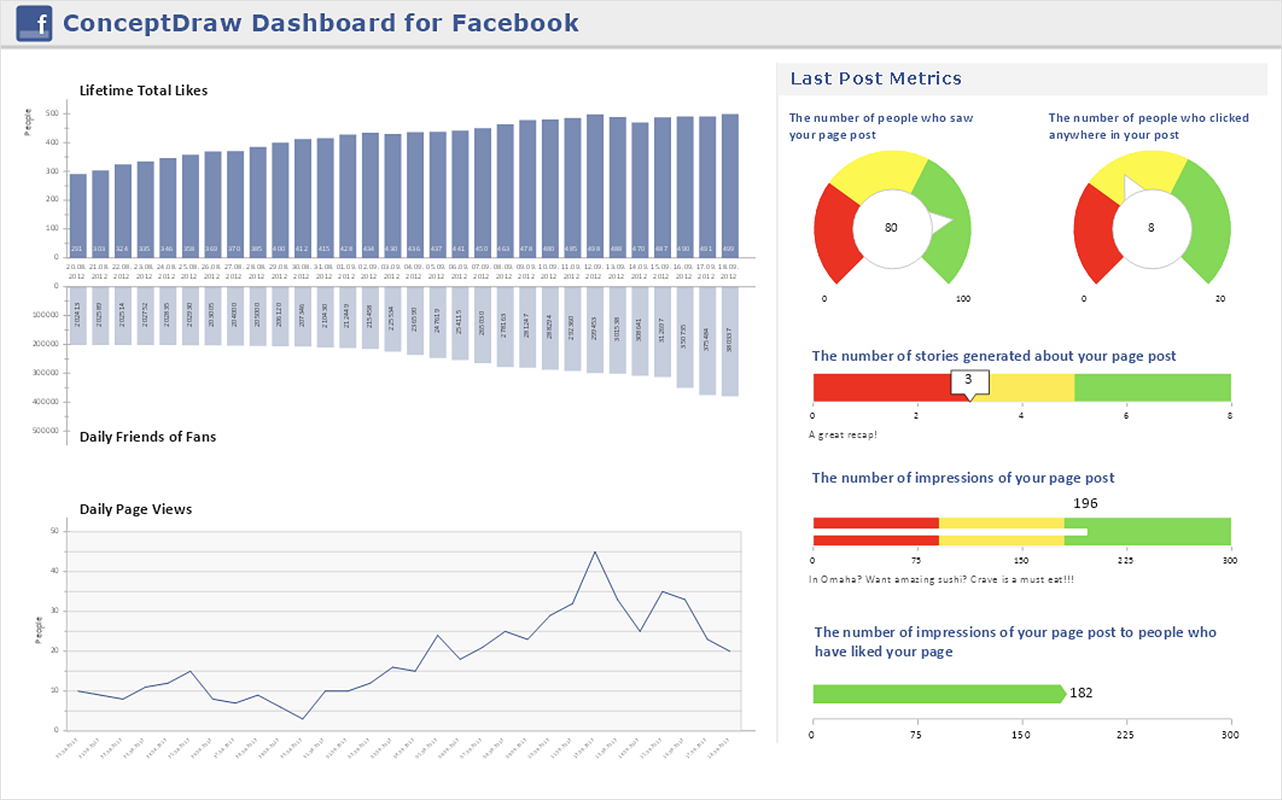
The ConceptDraw Dashboard for Facebook Solution is a visual dashboard that visualizes lifetime total Likes, daily Friends of Fans, and daily Page views based on the information exported from your Facebook Page.SWOT Matrix Template
A SWOT analysis can be carried out for a product, place, industry or person. It involves specifying the objective of the business venture or project and identifying the internal and external factors that are favorable and unfavorable to achieving that objective.SWOT Template
The "SWOT Analysis" solution gives simple visual support for all the steps of a SWOT Analysis process. SWOT analysis is a strategic planning method used to evaluate the Strengths, Weaknesses, Opportunities, and Threats facing a project. The new template for ConceptDraw MINDMAP isually supports identifying internal and external factors that are favorable and unfavorable. When the analysis is complete, output your data to a SWOT Matrix in ConceptDraw DIAGRAM for exporting to a variety of other formats: MS Visio, PowerPoint presentation, PDF, image files, etc.HelpDesk
How to Use ConceptDraw Dashboard for Facebook on PC
The ConceptDraw Dashboard for Facebook Solution is a visual dashboard that visualizes lifetime total Likes, daily Friends of Fans, and daily Page views based on the information exported from your Facebook Page.
 Soccer
The Soccer (Football) Solution extends ConceptDraw DIAGRAM.5 (or later) software with samples, templates, and libraries of vector objects for drawing soccer (football) diagrams, plays schemas, and illustrations. It can be used to make professional looking
KPI Dashboard
ConceptDraw DIAGRAM diagramming and vector drawing software supplied with Sales Dashboard solution from the Marketing area of ConceptDraw Solution Park provides the full set of useful tools which make it the best for producing the live KPI Dashboard of any complexity.- Powerpoint Project Dashboard Template
- Free Dashboard Templates Powerpoint
- KPI Dashboard | What is a KPI? | Sales Dashboard Template | Kpi ...
- Sales Dashboard | Presentation Exchange | Accounting Flowcharts ...
- Template For Sales Report Ppt
- Sales Dashboard | Entity-Relationship Diagram (ERD) | Cross ...
- Status Dashboard | PM Dashboards | How to Create Project ...
- KPI Dashboard | What is a KPI? | Sales Dashboard | Template ...
- Visualization Of Kpi Ppt
- Sales Dashboard | Applications | Software development with ...
- Project Dashboard Examples Free
- Dashboard Presentation Free Download
- How To Create Project Report | | Business Intelligence Dashboard ...
- How to Create Project Dashboard on Mac | How to Simplify Flow ...
- Football Field Template For Powerpoint
- How To Make Network Project Presentation With Powerpoint
- Ms Project Dashboard Report
- Sample Kpi Presentation
- Sample Workflow Powerpoint Presentation
- How to Create Project Dashboard on Mac | Pie Charts | How to ...
- ERD | Entity Relationship Diagrams, ERD Software for Mac and Win
- Flowchart | Basic Flowchart Symbols and Meaning
- Flowchart | Flowchart Design - Symbols, Shapes, Stencils and Icons
- Flowchart | Flow Chart Symbols
- Electrical | Electrical Drawing - Wiring and Circuits Schematics
- Flowchart | Common Flowchart Symbols
- Flowchart | Common Flowchart Symbols
