Organizational Units

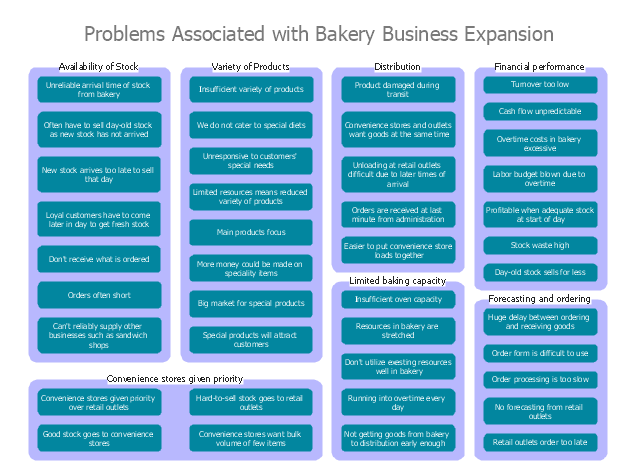
"An economic expansion is an increase in the level of economic activity, and of the goods and services available. It is a period of economic growth as measured by a rise in real GDP. The explanation of such fluctuations in aggregate economic activity is one of the primary concerns of macroeconomics.
Typically an economic expansion is marked by an upturn in production and utilization of resources. Economic recovery and prosperity are two successive phases of expansion. It may be caused by factors external to the economy, such as weather conditions or technical change, or by factors internal to the economy, such as fiscal policies, monetary policies, the availability of credit, interest rates, regulatory policies or other impacts on producer incentives. Global conditions may influence the levels of economic activity in various countries." [Economic expansion. Wikipedia]
"The term business cycle (or economic cycle or boom-bust cycle) refers to economy-wide fluctuations in production, trade and economic activity in general over several months or years in an economy organized on free-enterprise principles.
The business cycle is the upward and downward movements of levels of GDP (gross domestic product) and refers to the period of expansions and contractions in the level of economic activities (business fluctuations) around its long-term growth trend.
These fluctuations occur around a long-term growth trend, and typically involve shifts over time between periods of relatively rapid economic growth (an expansion or boom), and periods of relative stagnation or decline (a contraction or recession)." [Business cycle. Wikipedia]
The affinity diagram example "Business expansion" was created using the ConceptDraw PRO diagramming and vector drawing software extended with the solution "Seven Management and Planning Tools" from the Management area of ConceptDraw Solution Park.
Affinity diagram
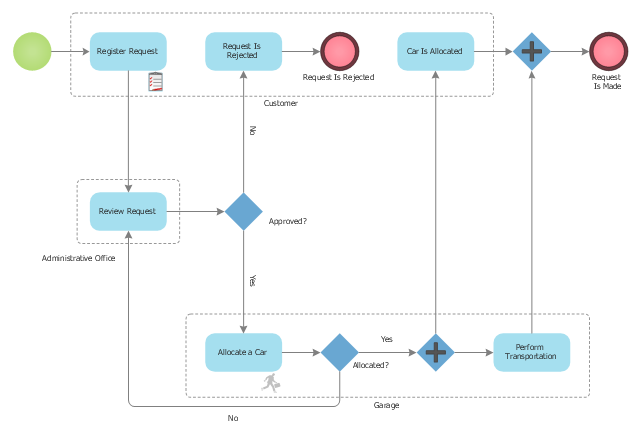
This BPMN (Business Process Model and Notation) diagram sample represents the taxi service order procedure workflow.
"A business process or business method is a collection of related, structured activities or tasks that produce a specific service or product (serve a particular goal) for a particular customer or customers. It often can be visualized with a flowchart as a sequence of activities with interleaving decision points or with a Process Matrix as a sequence of activities with relevance rules based on data in the process. ...
There are three types of business processes:
(1) Management processes, the processes that govern the operation of a system. Typical management processes include "corporate governance" and "strategic management".
(2) Operational processes, processes that constitute the core business and create the primary value stream. Typical operational processes are purchasing, manufacturing, advertising and marketing, and sales.
(3) Supporting processes, which support the core processes. Examples include accounting, recruitment, call center, technical support. ...
The ... improvement areas are equally applicable to policies, processes and detailed procedures (sub-processes/ tasks). There is a cascading effect of improvements made at a higher level on those made at a lower level.
For instance, if a recommendation to replace a given policy with a better one is made with proper justification and accepted in principle by business process owners, then corresponding changes in the consequent processes and procedures will follow naturally in order to enable implementation of the policies" [Business process. Wikipedia]
The business process modeling diagram example "Taxi service order procedure - BPMN 1.2 diagram" was created using the ConceptDraw PRO diagramming and vector drawing software extended with the Business Process Diagram solution from the Business Processes area of ConceptDraw Solution Park.
Business process modeling
The cycle diagram sample was created on the base of the figure illustrating the webpage "2. POLICY & STRATEGY" of "Scottish Police College Primary Inspection 2006: A Report by Her Majesty's Inspectorate of Constabulary" from the Scottish Government website.
"Strategic Planning.
2.1 The planning process for the College currently follows a structured approach, starting in April and extending through the financial year. The planning cycle is illustrated in figure 2. ...
2.2 The College recognises the need to consult with its customers and stakeholders in the process of setting objectives and directing the training programme. The planning cycle to date refers to force visits, environmental scanning, the course planning process which involves consultation with all forces and other common police services, as well as to a survey of external providers.
2.3 The information from consultation feeds into an EFQM framework from which the College has identified four key policies, namely:
(1) developing and delivering quality training;
(2) developing our people through lifelong learning;
(3) continuous improvement of our service; and
(4) embracing the changing environment.
2.4 The objectives set at divisional level are designed to contribute to delivering these policies. HMIC found that whilst the selected objectives were presented in line with the structure, not all could be considered to meet SMART (Specific, Measurable, Achievable, Relevant and Timed) criteria. This failure indicates that while the process appears suitably structured to deliver a robust result, some of those involved could perhaps have a better understanding of the process." [scotland.gov.uk/ Publications/ 2007/ 02/ 15134652/ 8]
The cycle diagram example "Strategic planning" was created using the ConceptDraw PRO diagramming and vector drawing software extended with the Target and Circular Diagrams solution from the Marketing area of ConceptDraw Solution Park.
www.conceptdraw.com/ solution-park/ marketing-target-and-circular-diagrams
Cycle diagram

Human Resource Management

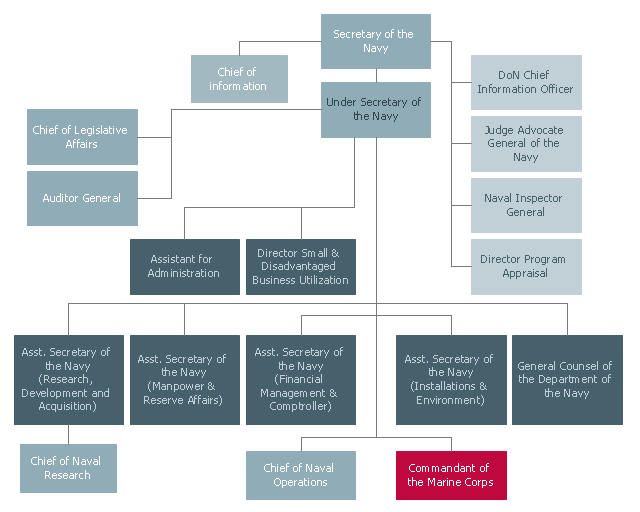
This Office of the Secretary of the Navy organization chart example was redesigned from the Wikimedia Commons file: US SECNAV org chart.png. [commons.wikimedia.org/ wiki/ File:US_ SECNAV_ org_ chart.png]
"The Secretary of the Navy (SECNAV) is responsible for, and has the authority under Title 10 of the United States Code, to conduct all the affairs of the Department of the Navy, including: recruiting, organizing, supplying, equipping, training, mobilizing, and demobilizing. The Secretary also oversees the construction, outfitting, and repair of naval ships, equipment and facilities. SECNAV is responsible for the formulation and implementation of policies and programs that are consistent with the national security policies and objectives established by the President and the Secretary of Defense. The Department of the Navy consists of two uniformed Services: the United States Navy and the United States Marine Corps." [navy.mil/ navydata/ organization/ org-sec.asp]
The org chart sample "US SECNAV" was created using the ConceptDraw PRO diagramming and vector drawing software extended with the 25 Typical Organizational Charts solution from the Management area of ConceptDraw Solution Park.
Org chart

Network Diagram Software ISG Network Diagram


Quality Management System

Active Directory Network. Computer and Network Examples

HR Management Software

The HR Management Software is an incredibly powerful tool for those who need to analyze or present human resource process flows in a visually effective manner.
Flow chart Example. Warehouse Flowchart

Standard warehousing process flow diagram and standard workflow diagram used for process identification for further evaluating effectiveness and profitability of overall business process. Use the ConceptDraw PRO diagramming and vector drawing software extended with the Flowcharts solution from the Diagrams area of ConceptDraw Solution Park to design your own workflow diagrams, process flow diagram and flow charts. Need to use Process Flow Diagram for designing Warehouse packages flow.

This onion diagram sample was created on the base of the figure "Social Ecological Model (SEM)" illustrating the webpage "Cultural Competence" from the US Centers for Disease Control and Prevention (CDC) website.
"Why consider cultural competence?
It is important to communicate effectively to both the disparately affected population(s) of interest as well as other key stakeholders at the community, state, and national levels.
The diagram of the Social Ecological Model (SEM) ... depicts how health behaviors of an individual (inner oval) are influenced by the interpersonal, organizational, community, and public policy contexts and environment in which that person exists. Cultural context resides in the interpersonal band, making it a critical consideration when designing any communication plan. All obesity prevention communications should take the culture (e.g., language, thoughts, communications, actions, customs, beliefs, values, and institutions of racial, ethnic, religious, or social groups) of the target population into consideration to be effective. Interventions that successfully achieve this goal demonstrate cultural competence - behaviors, attitudes, and policies that come together in a system, agency, or among professionals to enable people to work effectively in a cross-cultural situation."
[cdc.gov/ obesity/ health_ equity/ culturalRelevance.html]
The onion diagram example "Social Ecological Model (SEM)" was created using the ConceptDraw PRO diagramming and vector drawing software extended with the Target and Circular Diagrams solution from the Marketing area of ConceptDraw Solution Park.
www.conceptdraw.com/ solution-park/ marketing-target-and-circular-diagrams
Onion diagram
---onion-diagram.png--diagram-flowchart-example.png)
"The general definition of an audit is a planned and documented activity performed by qualified personnel to determine by investigation, examination, or evaluation of objective evidence, the adequacy and compliance with established procedures, or applicable documents, and the effectiveness of implementation. The term may refer to audits in accounting, internal controls, quality management, project management, water management, and energy conservation.
Auditing is defined as a systematic and independent examination of data, statements, records, operations and performances (financial or otherwise) of an enterprise for a stated purpose. In any auditing the auditor perceives and recognizes the propositions before him for examination, collects evidence, evaluates the same and on this basis formulates his judgment which is communicated through his audit report. The purpose is then to give an opinion on the adequacy of controls (financial and otherwise) within an environment they audit, to evaluate and improve the effectiveness of risk management, control, and governance processes." [Audit. Wikipedia]
The audit flowchart example "Audit process flowchart" was created using the ConceptDraw PRO diagramming and vector drawing software extended with the Audit Flowcharts solution from the Finance and Accounting area of ConceptDraw Solution Park.
Audit Process Flowchart
.png--diagram-flowchart-example.png)
Section 1
.png--diagram-flowchart-example.png)
Section 2
.png--diagram-flowchart-example.png)
- Hr Policies
- Block Diagram Of Planning And Maintaining Group Policies
- Fishbone Diagram Provider Policies
- Security Policy And Block Diagram
- Warehouse Policy Sample
- Purpose Of Business Policies Diagram
- Active Directory Policies
- Security Policies With Tree Diagram
- Group Policy Diagram Windows
- Social determinants of health | Healthhub Solutions
- Flow Chart Of Policy Management
- Business Policy Concept Map
- Firewall Policy Service Diagram
- Strategic planning - Cycle diagram | Divided Bar Diagrams ...
- HR Flowcharts | Recruitment | Taxi service order procedure - BPMN ...
- Affinity diagram - Business expansion | Organizational Charts with ...
- BPR Diagram. Business Process Reengineering Example | Affinity ...
- Sales Growth. Bar Graphs Example | Affinity diagram - Business ...
- Resources and TEAF Work Products for EA Direction, Description ...
- Active Directory Group Policy Drawing
- ERD | Entity Relationship Diagrams, ERD Software for Mac and Win
- Flowchart | Basic Flowchart Symbols and Meaning
- Flowchart | Flowchart Design - Symbols, Shapes, Stencils and Icons
- Flowchart | Flow Chart Symbols
- Electrical | Electrical Drawing - Wiring and Circuits Schematics
- Flowchart | Common Flowchart Symbols
- Flowchart | Common Flowchart Symbols