This circle diagram sample was redesigned from the Wikimedia Commons file: Research cycle.png. "Some of the basic elements of the scientific method, arranged in a cycle to emphasize that it is an iterative process." [commons.wikimedia.org/ wiki/ File:Research_ cycle.png]
This file is licensed under the Creative Commons Attribution 2.0 Generic license. [creativecommons.org/ licenses/ by/ 2.0/ deed.en]
"The scientific method is a body of techniques for investigating phenomena, acquiring new knowledge, or correcting and integrating previous knowledge. To be termed scientific, a method of inquiry must be based on empirical and measurable evidence subject to specific principles of reasoning. ...
Four essential elements of the scientific method are iterations, recursions, interleavings, or orderings of the following:
(1) Characterizations (observations, definitions, and measurements of the subject of inquiry).
(2) Hypotheses (theoretical, hypothetical explanations of observations and measurements of the subject).
(3) Predictions (reasoning including logical deduction from the hypothesis or theory).
(4) Experiments (tests of all of the above)...
A linearized, pragmatic scheme of the four points above is sometimes offered as a guideline for proceeding:
(1) Define a question.
(2) Gather information and resources (observe).
(3) Form an explanatory hypothesis.
(4) Test the hypothesis by performing an experiment and collecting data in a reproducible manner.
(5) Analyze the data.
(6) Interpret the data and draw conclusions that serve as a starting point for new hypothesis.
(7) Publish results.
(8) Retest (frequently done by other scientists).
The iterative cycle inherent in this step-by-step method goes from point 3 to 6 back to 3 again." [Scientific method. Wikipedia]
The circle diagram example "Research cycle" was created using the ConceptDraw PRO diagramming and vector drawing software extended with the Target and Circular Diagrams solution from the Marketing area of ConceptDraw Solution Park.
www.conceptdraw.com/ solution-park/ marketing-target-and-circular-diagrams
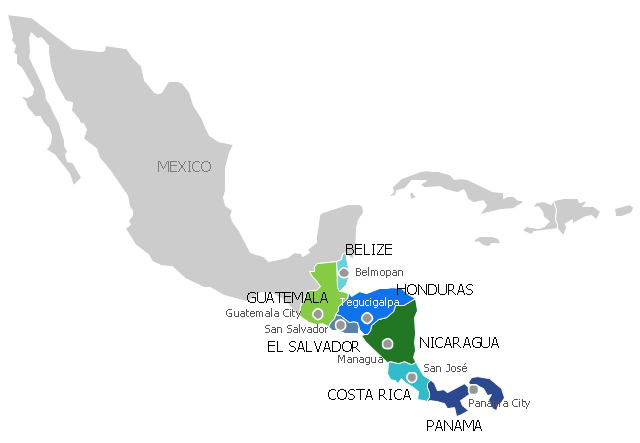
"Central America ... is the central geographic region of the Americas. It is the southernmost, isthmian portion of the North American continent, which connects with South America on the southeast. When considered part of the unified continental model, it is considered a subcontinent. Central America consists of seven countries: Belize, Costa Rica, El Salvador, Guatemala, Honduras, Nicaragua, and Panama. Central America is part of the Mesoamerican biodiversity hotspot, which extends from northern Guatemala through central Panama. It is bordered by Mexico to the north, the Caribbean Sea to the east, the North Pacific Ocean to the west, and Colombia to the south-east, which is also the most southern point of North America." [Central America. Wikipedia]
This example Political map of Central America was redesigned from Wikimedia Commons file: Map of Central America.png. [commons.wikimedia.org/ wiki/ File:Map_ of_ Central_ America.png]
This file is licensed under the Creative Commons Attribution-Share Alike 3.0 Unported license. [creativecommons.org/ licenses/ by-sa/ 3.0/ deed.en]
The example "Political map of Central America" was created using the ConceptDraw PRO diagramming and vector drawing software extended with the Continent Maps solution from the Maps area of ConceptDraw Solution Park.
DroidDia PRO unlocker
Droiddia allows you to make flow charts org charts venn diagrams mindmaps and do other diagrams with no constrains and as little effort as possible.ConceptDraw Arrows10 Technology
How should diagramming software work? Is it possible to develop a diagram as quickly as the ideas come to you? The innovative ConceptDraw Smart Connectors Technology - This is more than enough versatility to draw any type of diagram with any degree of complexity.Connection points are necessary for diagramming network, flowchart and organizational charts. In ConceptDraw you connect shapes by attaching, or snapping and gluing, connectors to shape connection points.
HelpDesk
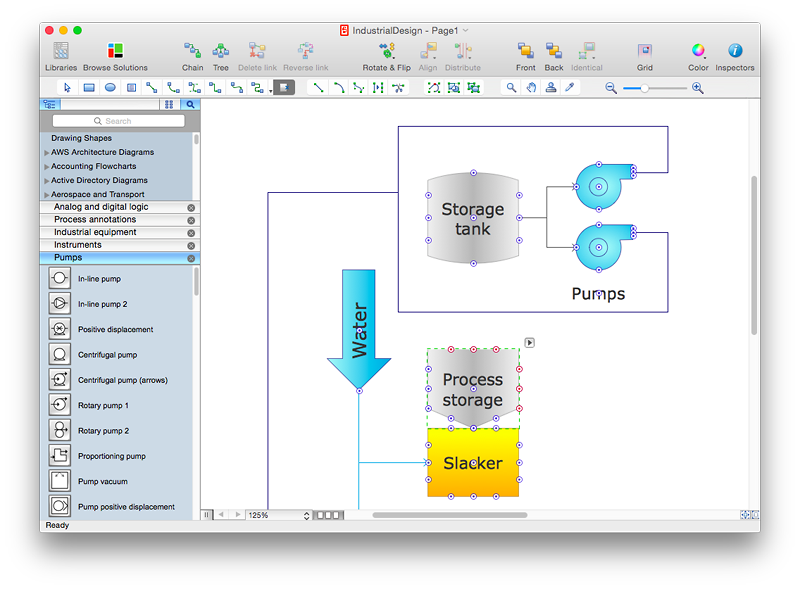
How to Add, Move, or Delete Connection Points in ConceptDraw PRO on Mac
Some tips on how to manage connection points in ConceptDraw PRO drawings on Macintosh. A connection point is a special point on an object that allows one to connect a connector. You can add connection points to any object or to the blank area in your document.This PFD sample was redesigned from the Wikipedia file: NaturalGasCondensate.png.
"This is a schematic flow diagram of a typical facility for separating and recovering liquid condensate from raw natural gas."
[en.wikipedia.org/ wiki/ File:NaturalGasCondensate.png]
"Natural-gas condensate is a low-density mixture of hydrocarbon liquids that are present as gaseous components in the raw natural gas produced from many natural gas fields. It condenses out of the raw gas if the temperature is reduced to below the hydrocarbon dew point temperature of the raw gas.
The natural gas condensate is also referred to as simply condensate, or gas condensate, or sometimes natural gasoline because it contains hydrocarbons within the gasoline boiling range. Raw natural gas may come from any one of three types of gas wells:
(1) Crude oil wells - Raw natural gas that comes from crude oil wells is called associated gas. This gas can exist separate from the crude oil in the underground formation, or dissolved in the crude oil.
(2) Dry gas wells - These wells typically produce only raw natural gas that does not contain any hydrocarbon liquids. Such gas is called non-associated gas.
(3) Condensate wells - These wells produce raw natural gas along with natural gas liquid. Such gas is also non-associated gas and often referred to as wet gas." [Natural-gas condensate. Wikipedia]
The process flow diagram example "Natural gas condensate - PFD" was drawn using the ConceptDraw PRO software extended with the Chemical and Process Engineering solution from the Chemical and Process Engineering area of ConceptDraw Solution Park.
- 3d Mountain Png
- Networking Equipment Images Png Hd
- Circular Png
- Topology Png
- Computer Switch Image Png
- Satellite Webcam Of Png
- 3 Combined Circles Diagram Png
- Cycle Process Png
- Network Tower Png
- Fire Extinguisher Clip Art Png
- Process Vector Png
- Invoice Vector Png
- Site Plans | Design elements - Transport map | Supermarket Signs Png
- Political map of Central America | Geo Map of Americas | Political ...
- Radio Waves Image Png
- 3d House Png
- Radio Tower Png
- Astrology Map Png
- Wallet Images Png
- Camera Clipart Png
- ERD | Entity Relationship Diagrams, ERD Software for Mac and Win
- Flowchart | Basic Flowchart Symbols and Meaning
- Flowchart | Flowchart Design - Symbols, Shapes, Stencils and Icons
- Flowchart | Flow Chart Symbols
- Electrical | Electrical Drawing - Wiring and Circuits Schematics
- Flowchart | Common Flowchart Symbols
- Flowchart | Common Flowchart Symbols


.jpg)


-natural-gas-condensate---pfd.png--diagram-flowchart-example.png)