 Pie Charts
Pie Charts are extensively used in statistics and business for explaining data and work results, in mass media for comparison (i.e. to visualize the percentage for the parts of one total), and in many other fields. The Pie Charts solution for ConceptDraw PRO v10 offers powerful drawing tools, varied templates, samples, and a library of vector stencils for simple construction and design of Pie Charts, Donut Chart, and Pie Graph Worksheets.
The vector stencils library "Map symbols" contains 10 spatial infographics symbols.
Use these signs and pictograms for drawing road and transit maps in the ConceptDraw PRO diagramming and vector drawing software extended with the Spatial Infographics solution from the area "What is Infographics" of ConceptDraw Solution Park.
Use these signs and pictograms for drawing road and transit maps in the ConceptDraw PRO diagramming and vector drawing software extended with the Spatial Infographics solution from the area "What is Infographics" of ConceptDraw Solution Park.
Windrose
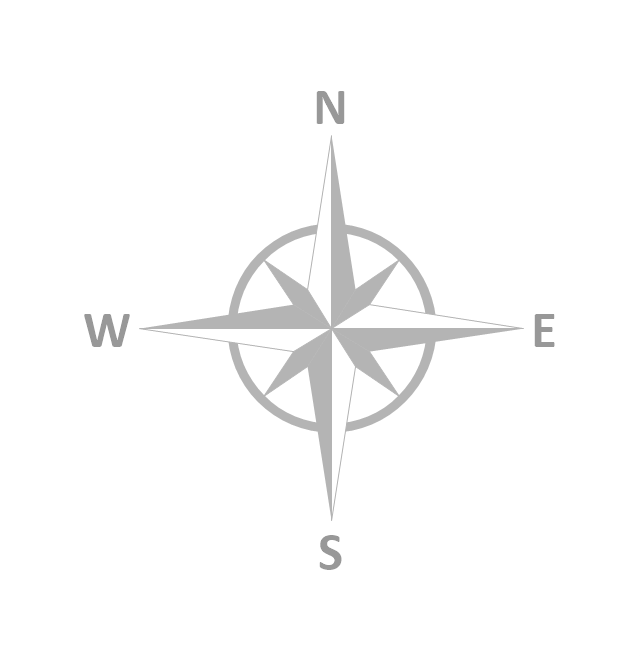
North arrow
North arrow
Callout

Callout

Location

Direction Right

Direction Left

Direction Up

Direction Down

 Seven Basic Tools of Quality
Manage quality control in the workplace, using fishbone diagrams, flowcharts, Pareto charts and histograms, provided by the Seven Basic Tools of Quality solution.
- Wavy Wind Arrow Png
- Wind Path Arrow Png
- Architectural Wind Arrow Png
- Wind Arrows Png
- Sun Arrow Png
- Map symbols - Vector stencils library | Wind Direction Arrows
- Sun Path Arrow Png
- Wind Direction Arrows Architecture
- Arrow Symbol For Speed Png
- Wind Rose Vector Png
- Arrow Sketch Png
- North Direction Png For Architecture
- Arrow Infographics Png
- Logo Vegetation Png
- Arrow Png For Visio
- Visio Arrows Png
- Wind Rose Png
- Renewable Power Png
- Earthquake Effect Png
- Sunlight Arrow Png
- ERD | Entity Relationship Diagrams, ERD Software for Mac and Win
- Flowchart | Basic Flowchart Symbols and Meaning
- Flowchart | Flowchart Design - Symbols, Shapes, Stencils and Icons
- Flowchart | Flow Chart Symbols
- Electrical | Electrical Drawing - Wiring and Circuits Schematics
- Flowchart | Common Flowchart Symbols
- Flowchart | Common Flowchart Symbols