The vector stencils library "Plots and fences" contains 27 plot and fence shapes.
Use it to create your landscape design and garden plans.
"A fence is a freestanding structure designed to restrict or prevent movement across a boundary. ... fences are used more frequently to provide visual sectioning of spaces. ...
Perimeter fencing, to prevent trespassing or theft and/ or to keep children and pets from wandering away.
Decorative fencing, to enhance the appearance of a property, garden or other landscaping." [Fence. Wikipedia]
The shapes example "Design elements - Plots and fences" was created using the ConceptDraw PRO diagramming and vector drawing software extended with the Landscape & Garden solution from the Building Plans area of ConceptDraw Solution Park.
Plots and fences icons
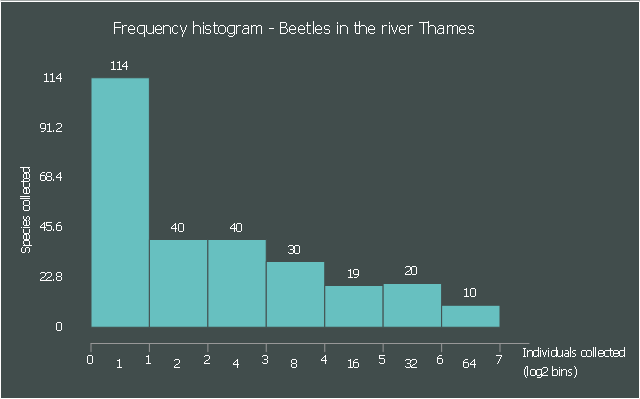
This frequency histogram sample shows the relative species abundance of beetles sampled from the river Thames. It was designed on the base of the Wikimedia Commons file: PrestonPlot beetles.png.
[commons.wikimedia.org/ wiki/ File:PrestonPlot_ beetles.png]
"Relative species abundance is a component of biodiversity and refers to how common or rare a species is relative to other species in a defined location or community. Relative species abundances tend to conform to specific patterns that are among the best-known and most-studied patterns in macroecology. ...
Relative species abundance distributions are usually graphed as frequency histograms (“Preston Plots”) or rank-abundance diagrams ("Whittaker Plots”)." [Relative species abundance. Wikipedia]
The frequency histogram example "Beetles in the river Thames" was created using the ConceptDraw PRO diagramming and vector drawing software extended with the Histograms solution from the Graphs and Charts area of ConceptDraw Solution Park.
Frequency histogram
- Design elements - Plots and fences | How to Draw a Landscape ...
- Scatter Graph Charting Software | Scatter Plot | Scatter graphs ...
- Business Plots
- Blank Scatter Plot | Bar Graph | The Best Drawing Program for Mac ...
- Blank Scatter Plot | Scatter Chart Examples | Four Dimensions ...
- Blank Scatter Plot | Scatter Chart Examples | Scatter Plot | How To ...
- Plot Map Design Software Free Download
- Scatter Diagrams | Blank Scatter Plot | How to Draw a Scatter ...
- Garden Design Rectangular Plot
- Landscape For Rectangular Plots
- Scatter Diagrams | Scatter Graph Charting Software | Scatter Graph ...
- Best Software For Making Plots
- Scatter Diagrams | Scatter Chart Examples | Scatter Graph | Scatter ...
- Four Dimensions Bubble Plot | Scatter Plot | Blank Scatter Plot | Plot ...
- Scatter Diagrams | Scatter Graph | Scatter Graph Charting Software ...
- Baby Age And Height Scatter Plot
- Time series charts - Vector stencils library | Design elements - Time ...
- Scatter Chart Examples | How to Draw a Scatter Diagram Using ...
- Dot Plot
- Time Series Dashboard | Design elements - Time series charts ...
- ERD | Entity Relationship Diagrams, ERD Software for Mac and Win
- Flowchart | Basic Flowchart Symbols and Meaning
- Flowchart | Flowchart Design - Symbols, Shapes, Stencils and Icons
- Flowchart | Flow Chart Symbols
- Electrical | Electrical Drawing - Wiring and Circuits Schematics
- Flowchart | Common Flowchart Symbols
- Flowchart | Common Flowchart Symbols