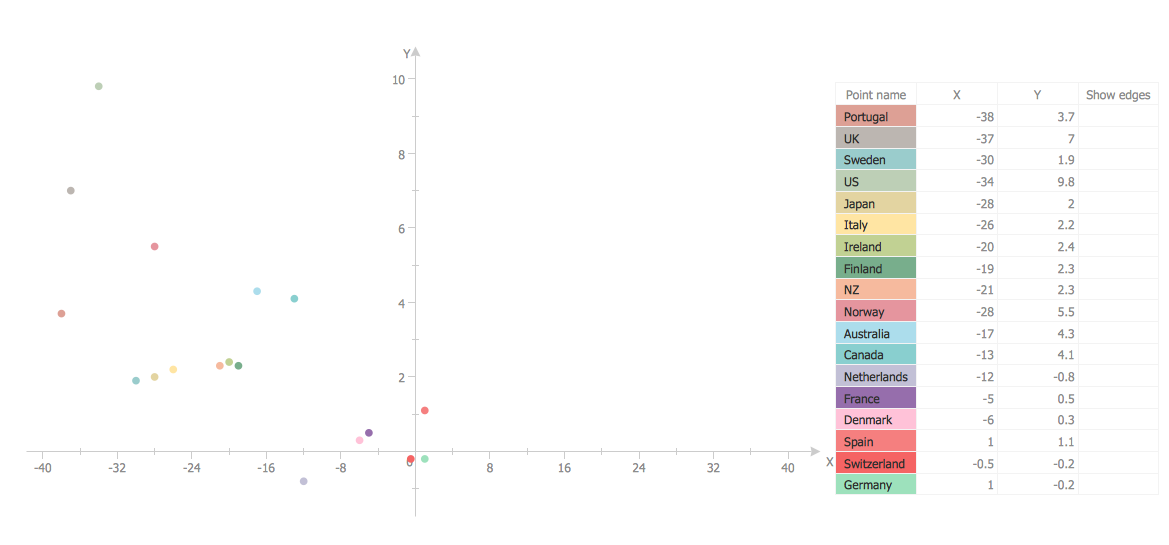
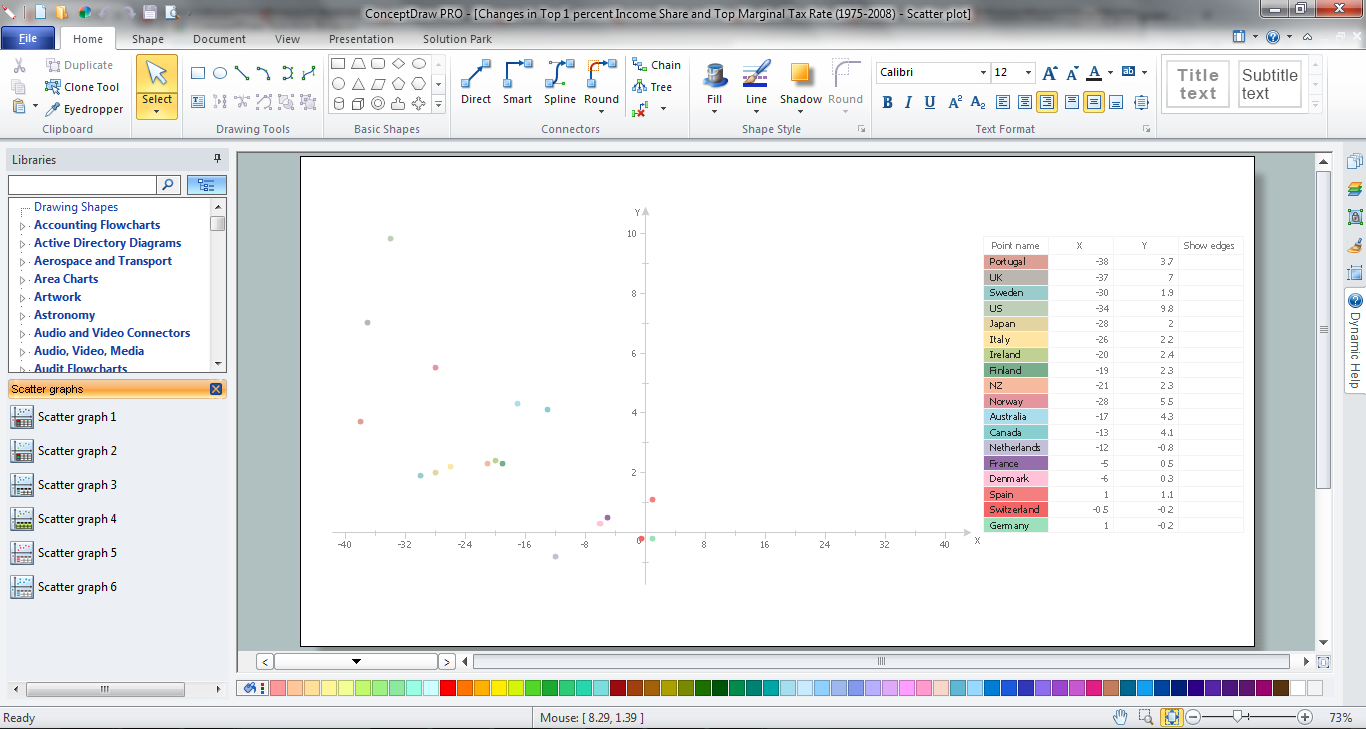
Scatter Graph Charting Software

Scatter Plot

Scatter Plot Graph
Four Dimensions Bubble Plot

This sample clearly shows the Four Dimensions Bubble Diagram of the distribution of chlorine contaminant in the water source. This Bubble Diagram is very useful in the chemistry, hydrology, and ecology.
Make a Scatter Plot
How To use Landscape Design Software

ConceptDraw DIAGRAM diagramming and vector drawing software extended with Landscape & Garden Solution offers powerful drawing tools and numerous collection of pre-designed vector objects for effective landscape design, landscape plans, deck plans, patio plans, floor plans.
Bubble Plot

This sample shows the BCG (Boston Consulting Group) matrix that is used in marketing and product management for strategic analysis and planning.
Blank Scatter Plot
How To Create a Bubble Chart

Using ConceptDraw you will be able to create a bubble chart from the ready ConceptDraw library objects or make your own objects. The created diagram can represent ideas organization, in brainstorming processes, by teachers for explaining difficult ideas or for presentations.
How To use House Electrical Plan Software

You can use many of built-in templates, electrical symbols and electical schemes examples of our House Electrical Diagram Software.
ConceptDraw is a fast way to draw: Electrical circuit diagrams, Schematics, Electrical Wiring, Circuit schematics, Digital circuits, Wiring in buildings, Electrical equipment, House electrical plans, Home cinema, Satellite television, Cable television, Closed-circuit television.
House Electrical Plan Software works across any platform, meaning you never have to worry about compatibility again. ConceptDraw DIAGRAM allows you to make electrical circuit diagrams on PC or macOS operating systems.

- Plot Map Design Software Free Download
- Design elements - Plots and fences | Plot Drawing Software
- Land Plot Layout Design Software
- Plant Layout Plans | Plot Layout Design Software
- Plant Layout Plans | Plot Design Software Free Download
- Plant Layout Plans | Plot Plan Software Free Download
- Scatter Graph Charting Software | Scatter Plot Graph | Scatter Chart ...
- Design elements - Plots and fences | Beetles in the river Thames ...
- Scatter Graph Charting Software | Scatter Plot | Scatter Chart ...
- Graph A Scatter Plot
- ERD | Entity Relationship Diagrams, ERD Software for Mac and Win
- Flowchart | Basic Flowchart Symbols and Meaning
- Flowchart | Flowchart Design - Symbols, Shapes, Stencils and Icons
- Flowchart | Flow Chart Symbols
- Electrical | Electrical Drawing - Wiring and Circuits Schematics
- Flowchart | Common Flowchart Symbols
- Flowchart | Common Flowchart Symbols