Scatter Graph Charting Software

Four Dimensions Bubble Plot

This sample clearly shows the Four Dimensions Bubble Diagram of the distribution of chlorine contaminant in the water source. This Bubble Diagram is very useful in the chemistry, hydrology, and ecology.
Site Plan Software
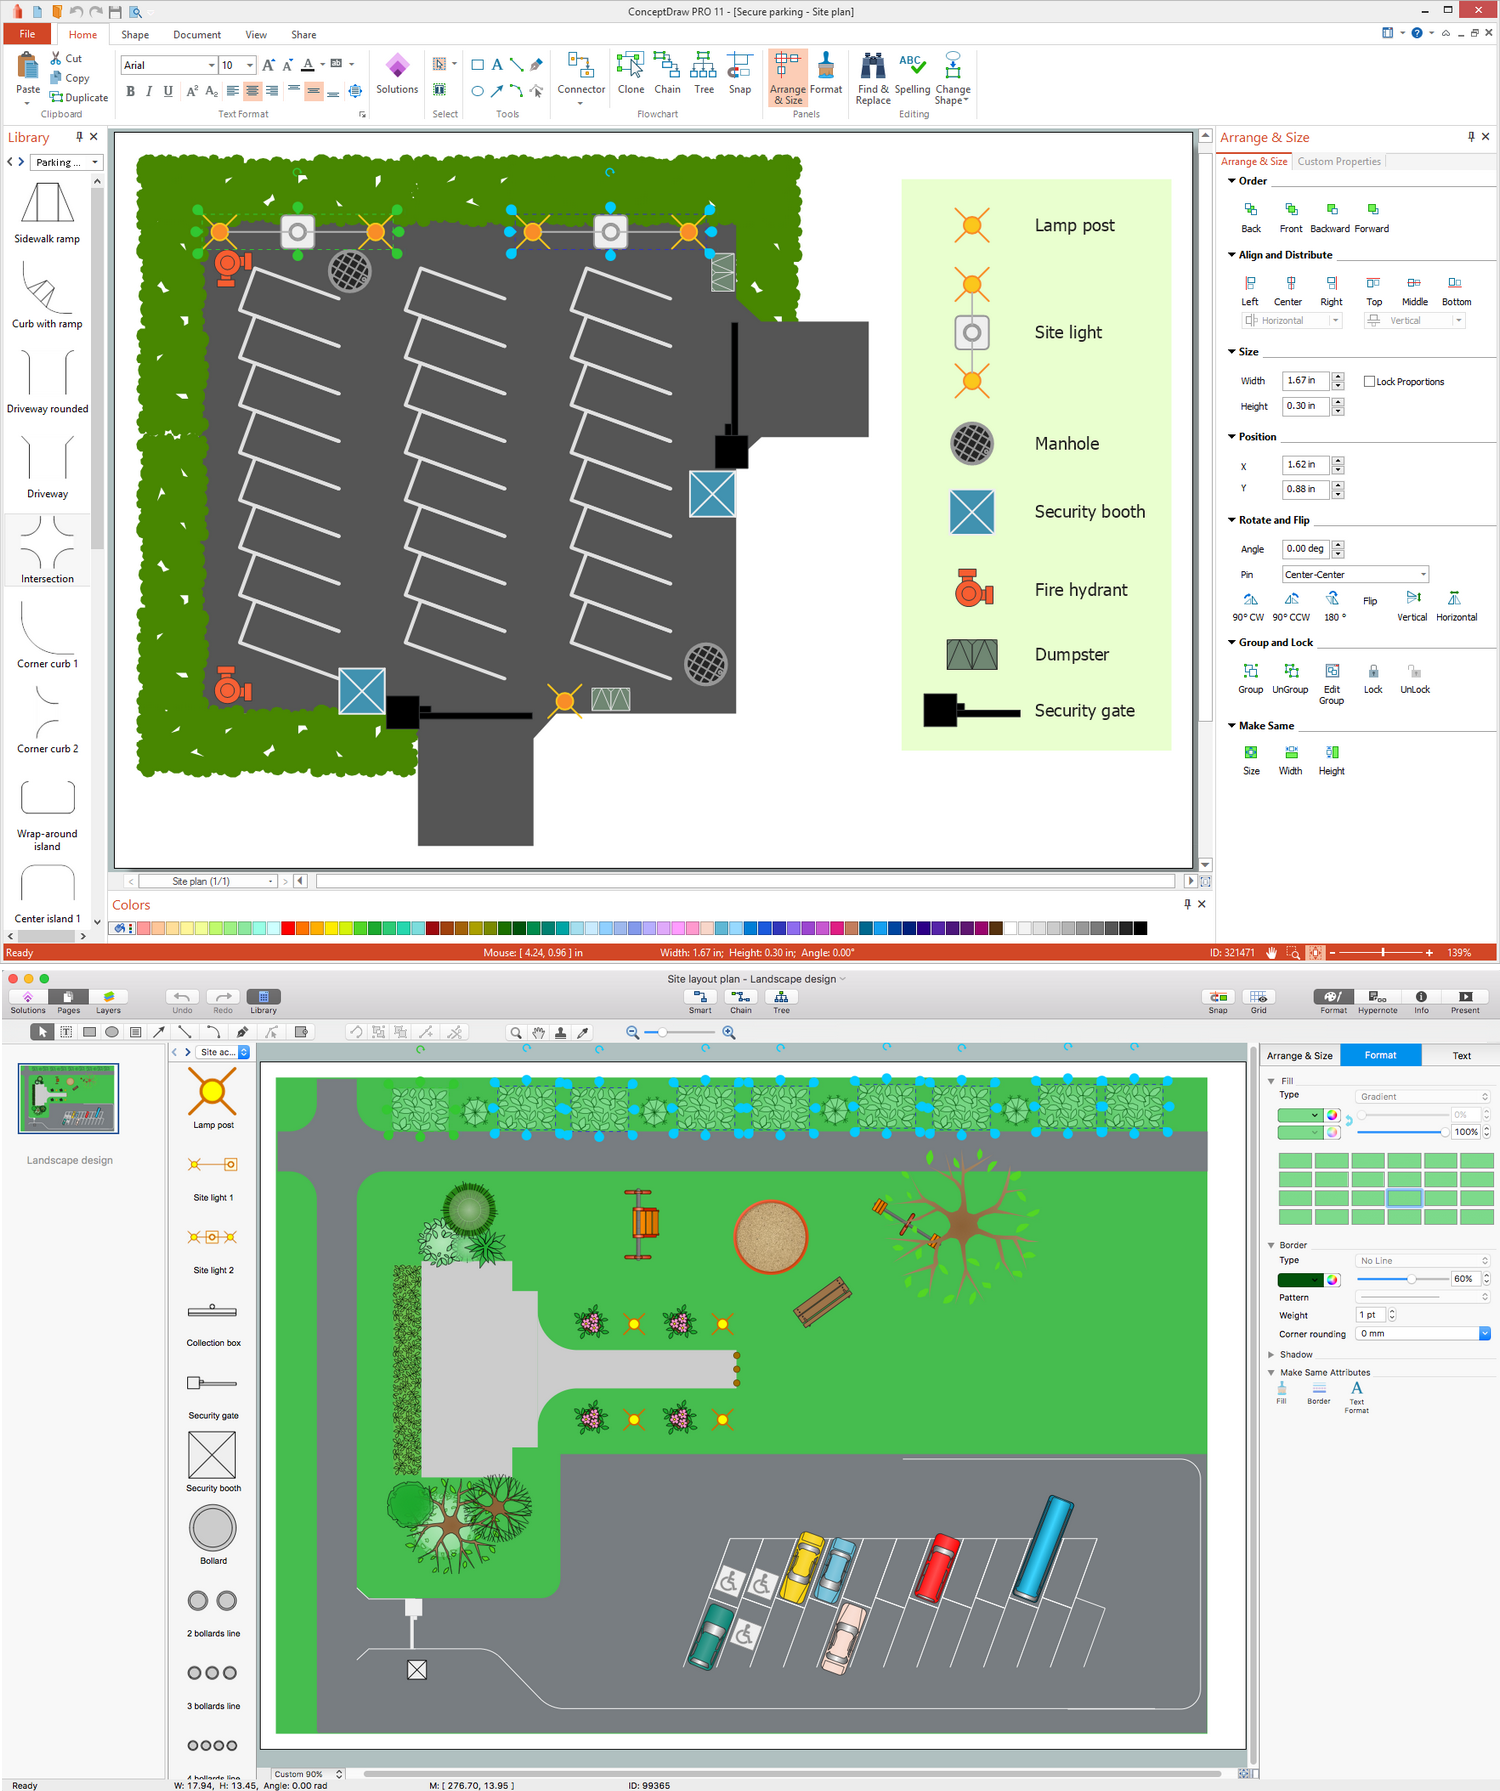
Landscape Architecture with ConceptDraw DIAGRAM
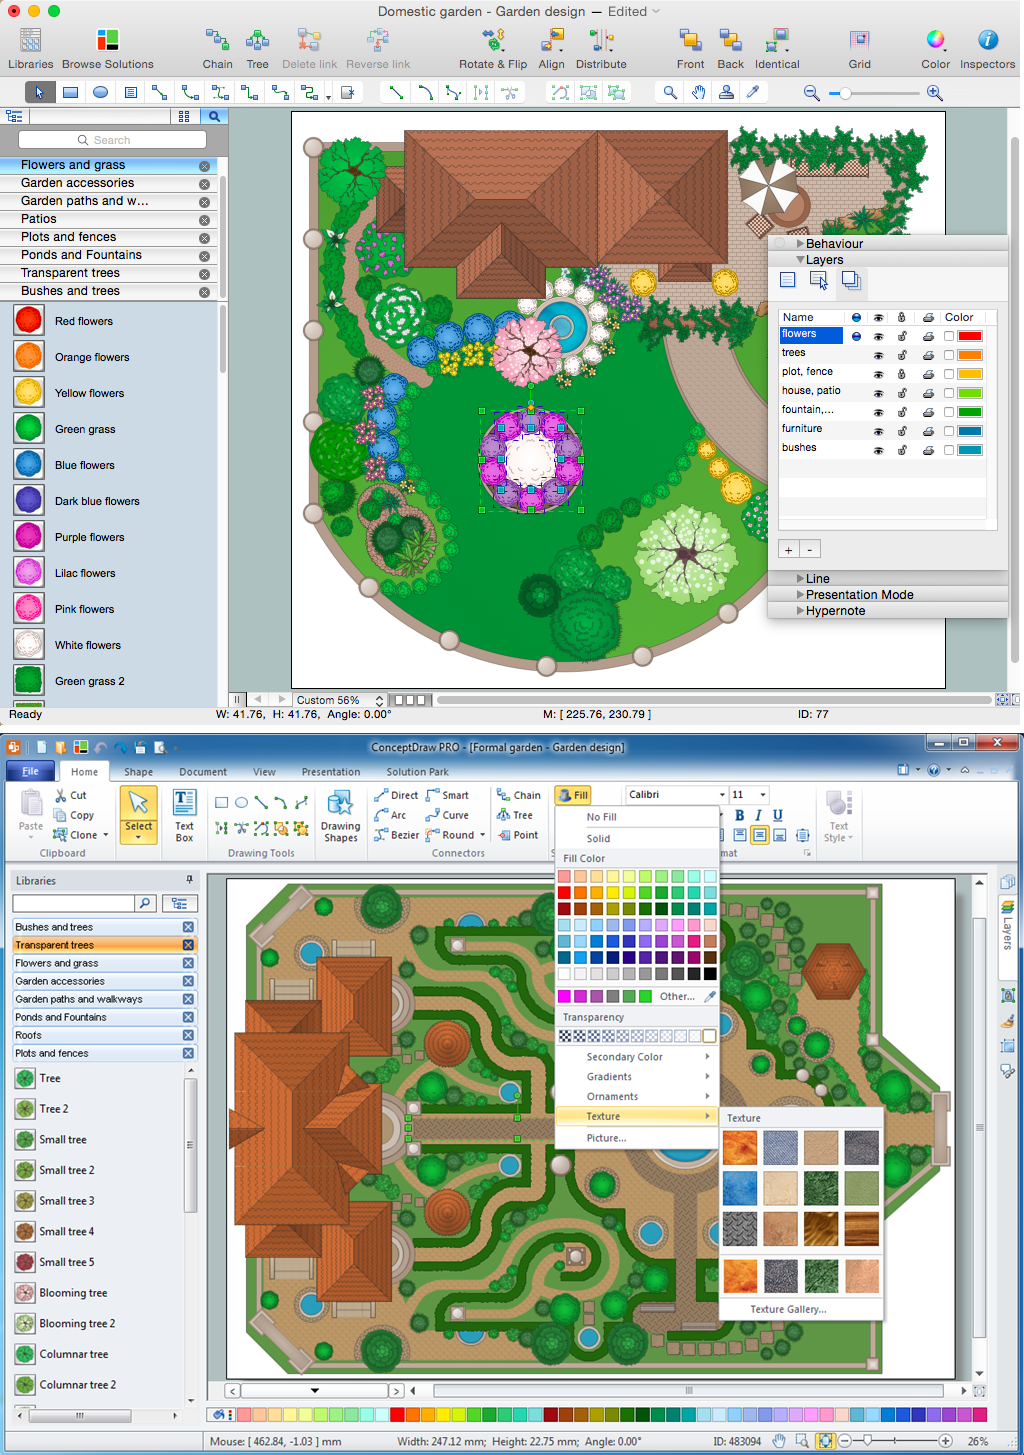
The Landscape and Garden solution contains 14 libraries containing 420 vector graphics shapes, is suitable for any green-fingered gardener wondering how to design a garden.
How To use House Electrical Plan Software

You can use many of built-in templates, electrical symbols and electical schemes examples of our House Electrical Diagram Software.
ConceptDraw is a fast way to draw: Electrical circuit diagrams, Schematics, Electrical Wiring, Circuit schematics, Digital circuits, Wiring in buildings, Electrical equipment, House electrical plans, Home cinema, Satellite television, Cable television, Closed-circuit television.
House Electrical Plan Software works across any platform, meaning you never have to worry about compatibility again. ConceptDraw DIAGRAM allows you to make electrical circuit diagrams on PC or macOS operating systems.

Process Flowchart


Blank Scatter Plot
Sign Making Software
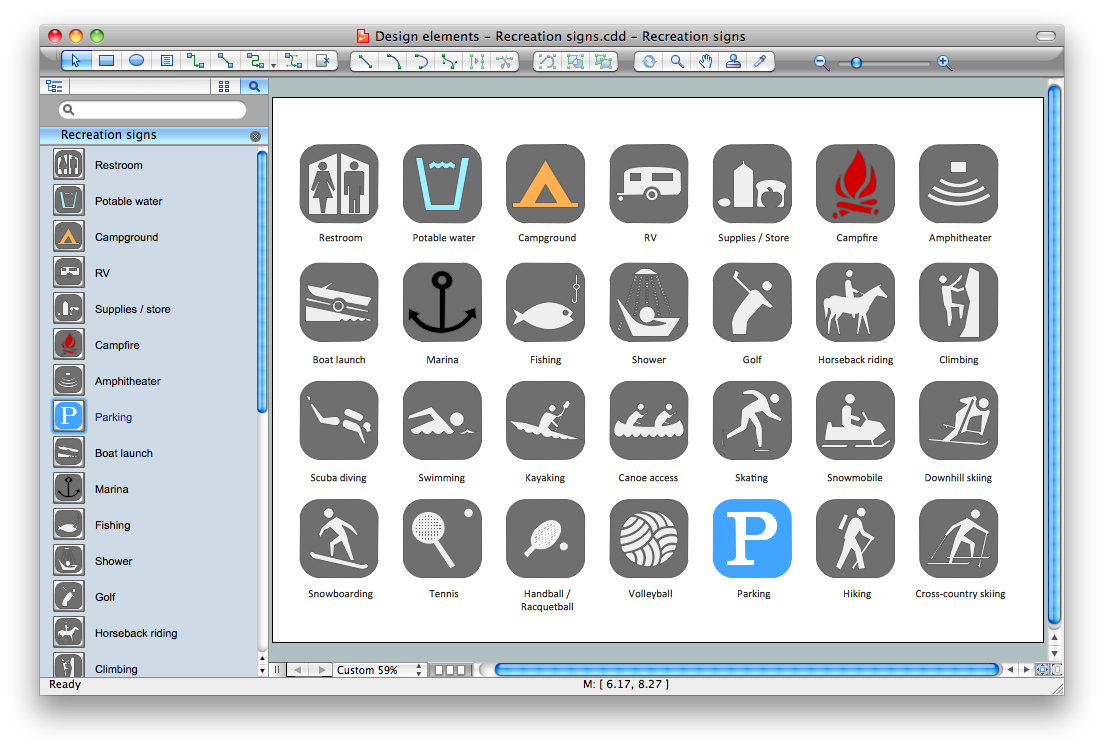
Sign making software is very useful tool for professional sign-making business. Use ConceptDraw DIAGRAM and make sure that now sign making is easier and timesaving than ever!
Organogram Software

Polar Graph

- Plot Map Design Software Free Download
- Plant Layout Plans | Plot Layout Design Software Free Download
- Network Layout | Land Layout Software Free Download
- Plant Layout Plans | Plot Plan Software Free Download
- Plant Layout Plans | Plot Layout Design Software
- Piping Design Software Free Download
- Land Plot Layout Design Software
- Chemical Plant Design Software Free Download
- Building Structure Design Software Free Download
- Plant Layout Plans | How to Draw a Natural Landscape | Software ...
- ERD | Entity Relationship Diagrams, ERD Software for Mac and Win
- Flowchart | Basic Flowchart Symbols and Meaning
- Flowchart | Flowchart Design - Symbols, Shapes, Stencils and Icons
- Flowchart | Flow Chart Symbols
- Electrical | Electrical Drawing - Wiring and Circuits Schematics
- Flowchart | Common Flowchart Symbols
- Flowchart | Common Flowchart Symbols