Use this exploded pie chart template in the ConceptDraw PRO diagramming and vector drawing software to visualize data as percentages of the whole, especially when small values are represented by narrow slices.
"A chart with one or more sectors separated from the rest of the disk is known as an exploded pie chart. This effect is used to either highlight a sector, or to highlight smaller segments of the chart with small proportions." [Pie chart. Wikipedia]
The template "Exploded pie chart" is included in the Pie Charts solution of the Graphs and Charts area in ConceptDraw Solution Park.
Circle chart
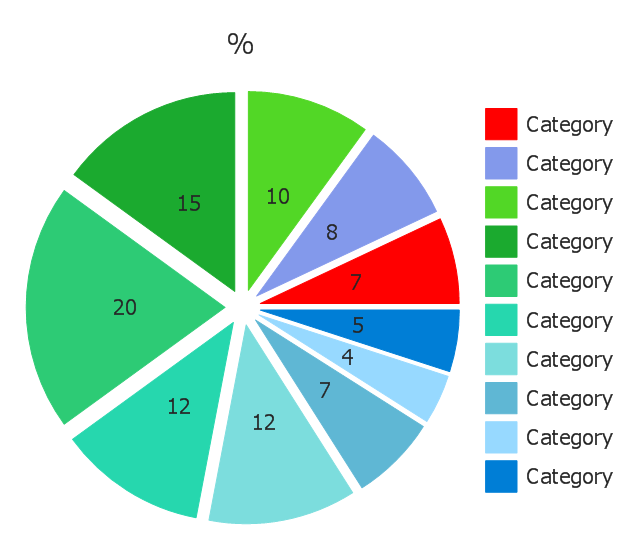
Use this exploded pie chart template in the ConceptDraw PRO diagramming and vector drawing software to emphasize a particular piece of your pie chart.
"A chart with one or more sectors separated from the rest of the disk is known as an exploded pie chart. This effect is used to either highlight a sector, or to highlight smaller segments of the chart with small proportions." [Pie chart. Wikipedia]
The template "Exploded pie chart (percentage)" is included in the Pie Charts solution of the Graphs and Charts area in ConceptDraw Solution Park.
Circle chart
---template.png--diagram-flowchart-example.png)
How to Create a Pie Chart

 Pie Charts
Pie Charts are extensively used in statistics and business for explaining data and work results, in mass media for comparison (i.e. to visualize the percentage for the parts of one total), and in many other fields. The Pie Charts solution for ConceptDraw DIAGRAM offers powerful drawing tools, varied templates, samples, and a library of vector stencils for simple construction and design of Pie Charts, Donut Chart, and Pie Graph Worksheets.
Pie Donut Chart. Pie Chart Examples

The Pie Donut Chart visualizes the percentage of parts of the whole and looks like as a ring divided into sectors. Pie Donut Charts are widely used in the business, statistics, analytics, mass media.
Relative Value Chart Software

Relative values are widely used in:business, economics, investment, management, marketing, statistics, etc.
ConceptDraw DIAGRAM software is the best for drawing professional looking Relative Value Charts. ConceptDraw DIAGRAM provides Divided Bar Diagrams solution from the Graphs and Charts Area of ConceptDraw Solution Park.
Bar Chart Examples

Competitor Analysis

Examples of Flowcharts, Org Charts and More


 Line Graphs
How to draw a Line Graph with ease? The Line Graphs solution extends the capabilities of ConceptDraw DIAGRAM with professionally designed templates, samples, and a library of vector stencils for drawing perfect Line Graphs.
- How to Draw the Different Types of Pie Charts | Visio Charting ...
- Pie Segment Chart Template
- Circle Diagrams | Circle Spoke Diagram Template | Sector diagram ...
- Arrow circle chart - Template | Exploded pie chart - Template | Chart ...
- Exploded pie chart (percentage) - Template | Exploded pie chart ...
- Business Report Pie . Pie Chart Examples | Pie Donut Chart . Pie ...
- Pie Chart Template
- Arrow circle chart - Template
- Pie Chart Word Template . Pie Chart Examples | Pie chart - Template ...
- Exploded pie chart - Template | Exploded pie chart (percentage ...
- ERD | Entity Relationship Diagrams, ERD Software for Mac and Win
- Flowchart | Basic Flowchart Symbols and Meaning
- Flowchart | Flowchart Design - Symbols, Shapes, Stencils and Icons
- Flowchart | Flow Chart Symbols
- Electrical | Electrical Drawing - Wiring and Circuits Schematics
- Flowchart | Common Flowchart Symbols
- Flowchart | Common Flowchart Symbols