HelpDesk
How to Draw the Different Types of Pie Charts

The vector stencils library "Pie charts" contains 30 templates of pie and donut (doughnut, ring) charts for visualizing percentage for parts of one total, or compare parts of few totals.
Drag a template from the library into your document and enter your data.
Use these shapes to draw your pie charts and donut charts in the ConceptDraw PRO diagramming and vector drawing software.
The vector stencils library "Pie charts" is included in the Pie Charts solution of the Graphs and Charts area in ConceptDraw Solution Park.
Pie chart (table)
-pie-charts---vector-stencils-library.png--diagram-flowchart-example.png)
Pie chart

Percentage pie chart

Pie chart, control dots

Separated pie chart

Percentage separated pie chart

Pie chart with shifted slices

Percentage pie chart with shifted slices

Ring chart (table)
-pie-charts---vector-stencils-library.png--diagram-flowchart-example.png)
Ring chart

Percentage ring chart

Ring chart 2

Percentage ring chart 2

Ring chart, control dots

Arrow ring chart
Percentage arrow ring chart
Pie chart (light)
-pie-charts---vector-stencils-library.png--diagram-flowchart-example.png)
Percentage pie chart (light)
-pie-charts---vector-stencils-library.png--diagram-flowchart-example.png)
Pie chart (light), control dots
,-control-dots-pie-charts---vector-stencils-library.png--diagram-flowchart-example.png)
Separated pie chart (light)
-pie-charts---vector-stencils-library.png--diagram-flowchart-example.png)
Percentage separated pie chart (light)
-pie-charts---vector-stencils-library.png--diagram-flowchart-example.png)
Pie chart with shifted slices (light)
-pie-charts---vector-stencils-library.png--diagram-flowchart-example.png)
Percentage pie chart with shifted slices (light)
-pie-charts---vector-stencils-library.png--diagram-flowchart-example.png)
Ring chart (light)
-pie-charts---vector-stencils-library.png--diagram-flowchart-example.png)
Percentage ring chart (light)
-pie-charts---vector-stencils-library.png--diagram-flowchart-example.png)
Ring chart (light) 2
-2-pie-charts---vector-stencils-library.png--diagram-flowchart-example.png)
Percentage ring chart (light) 2
-2-pie-charts---vector-stencils-library.png--diagram-flowchart-example.png)
Ring chart (light), control dots
,-control-dots-pie-charts---vector-stencils-library.png--diagram-flowchart-example.png)
Arrow ring chart (light)
Percentage arrow ring chart (light)
The vector stencils library "Circular diagrams" contains 42 templates of circular diagrams: circular arrow diagram, circular motion diagram, arrow ring chart, doughnut chart (donut chart), circle pie chart, diamond pie chart, circle diagram, pie chart, ring chart, loop diagram, block loop diagram, arrow loop circle, crystal diagram, triangular diagram, diamond diagram, pentagon diagram, hexagon diagram, heptagon diagram, cycle diagram (cycle chart), stacked Venn diagram (onion diagram), arrow circle diagram.
Use these shapes to illustrate your marketing and sales documents, presentations, webpages and infographics in the ConceptDraw PRO diagramming and vector drawing software extended with the Target and Circular Diagrams solution from the Marketing area of ConceptDraw Solution Park.
www.conceptdraw.com/ solution-park/ marketing-target-and-circular-diagrams
Circular arrow diagram 1
Circular arrow diagram 2
Arrow ring chart
Doughnut chart

Diamond pie chart

Pie chart

Circle diagram

Circle pie chart 2

Circle pie chart 1

Ring chart 1 - 3 elements

Ring chart 1 - 4 elements

Ring chart 1 - 5 elements

Ring chart 1 - 6 elements

Ring chart 1 - 7 elements

Ring chart 2 - 3 elements

Ring chart 2 - 4 elements

Ring chart 2 - 5 elements

Ring chart 2 - 6 elements

Ring chart 2 - 7 elements

Crystal diagram - 3 elements

Crystal diagram - 4 elements

Crystal diagram - 5 elements

Crystal diagram - 6 elements

Crystal diagram - 7 elements

Stacked Venn diagram - 4

Stacked Venn diagram - 5

Stacked Venn diagram - 6

Stacked Venn diagram - 7

Basic loop diagram

Block loop diagram

Arrow loop circle
Arrow loop - 3 circles
Arrow loop - 4 circles
Arrow loop - 5 circles
Arrow loop - 6 circles
Arrow loop - 7 circles
Arrow circle diagram - 3
Arrow circle diagram - 4
Stacked Venn diagram - 3

Arrow circle diagram - 5
Arrow circle diagram - 6
Arrow circle diagram - 7
How to Create a Pie Chart

The vector stencils library "Circular diagrams" contains 42 templates of circular diagrams: circular arrow diagram, circular motion diagram, arrow ring chart, doughnut chart (donut chart), circle pie chart, diamond pie chart, circle diagram, pie chart, ring chart, loop diagram, block loop diagram, arrow loop circle, crystal diagram, triangular diagram, diamond diagram, pentagon diagram, hexagon diagram, heptagon diagram, cycle diagram (cycle chart), stacked Venn diagram (onion diagram), arrow circle diagram.
Use these shapes to illustrate your marketing and sales documents, presentations, webpages and infographics in the ConceptDraw PRO diagramming and vector drawing software extended with the Target and Circular Diagrams solution from the Marketing area of ConceptDraw Solution Park.
www.conceptdraw.com/ solution-park/ marketing-target-and-circular-diagrams
Use these shapes to illustrate your marketing and sales documents, presentations, webpages and infographics in the ConceptDraw PRO diagramming and vector drawing software extended with the Target and Circular Diagrams solution from the Marketing area of ConceptDraw Solution Park.
www.conceptdraw.com/ solution-park/ marketing-target-and-circular-diagrams
Circular arrow diagram 1
Circular arrow diagram 2
Arrow ring chart
Doughnut chart
Diamond pie chart
Pie chart
Circle diagram
Circle pie chart 2
Circle pie chart 1
Ring chart 1 - 3 elements
Ring chart 1 - 4 elements
Ring chart 1 - 5 elements
Ring chart 1 - 6 elements
Ring chart 1 - 7 elements
Ring chart 2 - 3 elements
Ring chart 2 - 4 elements
Ring chart 2 - 5 elements
Ring chart 2 - 6 elements
Ring chart 2 - 7 elements
Crystal diagram - 3 elements
Crystal diagram - 4 elements
Crystal diagram - 5 elements
Crystal diagram - 6 elements
Crystal diagram - 7 elements
Stacked Venn diagram - 4
Stacked Venn diagram - 5
Stacked Venn diagram - 6
Stacked Venn diagram - 7
Basic loop diagram
Block loop diagram
Arrow loop circle
Arrow loop - 3 circles
Arrow loop - 4 circles
Arrow loop - 5 circles
Arrow loop - 6 circles
Arrow loop - 7 circles
Arrow circle diagram - 3
Arrow circle diagram - 4
Stacked Venn diagram - 3
Arrow circle diagram - 5
Arrow circle diagram - 6
Arrow circle diagram - 7
Donut Chart

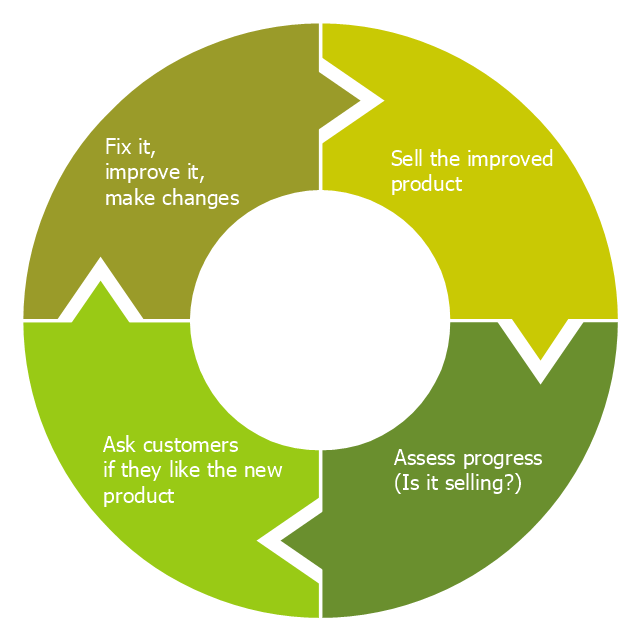
"Feedback is a process in which information about the past or the present influences the same phenomenon in the present or future. As part of a chain of cause-and-effect that forms a circuit or loop, the event is said to "feed back" into itself. ...
Feedback loop - the complete causal path that leads from the initial detection of the gap to the subsequent modification of the gap. ...
Feedback is commonly divided into two types - usually termed positive and negative. The terms can be applied in two contexts:
(1) the altering of the gap between reference and actual values of a parameter, based on whether the gap is widening (positive) or narrowing (negative),
(2) the valence of the action or effect that alters the gap, based on whether it has a happy (positive) or unhappy (negative) emotional connotation to the recipient or observer." [Feedback. Wikipedia]
This cycle diagram example was redesigned from the Wikimedia Commons file: Business Feedback Loop.jpg. [commons.wikimedia.org/ wiki/ File:Business_ Feedback_ Loop.jpg]
This file is made available under the Creative Commons CC0 1.0 Universal Public Domain Dedication. [creativecommons.org/ publicdomain/ zero/ 1.0/ deed.en]
The ring chart example "Business feedback loop" was created using the ConceptDraw PRO diagramming and vector drawing software extended with the Target and Circular Diagrams solution from the Marketing area of ConceptDraw Solution Park.
www.conceptdraw.com/ solution-park/ marketing-target-and-circular-diagrams
Ring chart
The vector stencils library "Circular diagrams" contains 42 templates of circular diagrams: circular arrow diagram, circular motion diagram, arrow ring chart, doughnut chart (donut chart), circle pie chart, diamond pie chart, circle diagram, pie chart, ring chart, loop diagram, block loop diagram, arrow loop circle, crystal diagram, triangular diagram, diamond diagram, pentagon diagram, hexagon diagram, heptagon diagram, cycle diagram (cycle chart), stacked Venn diagram (onion diagram), arrow circle diagram.
Use these shapes to illustrate your marketing and sales documents, presentations, webpages and infographics in the ConceptDraw PRO diagramming and vector drawing software extended with the Target and Circular Diagrams solution from the Marketing area of ConceptDraw Solution Park.
www.conceptdraw.com/ solution-park/ marketing-target-and-circular-diagrams
Use these shapes to illustrate your marketing and sales documents, presentations, webpages and infographics in the ConceptDraw PRO diagramming and vector drawing software extended with the Target and Circular Diagrams solution from the Marketing area of ConceptDraw Solution Park.
www.conceptdraw.com/ solution-park/ marketing-target-and-circular-diagrams
Circular arrow diagram 1
Circular arrow diagram 2
Arrow ring chart
Doughnut chart
Diamond pie chart
Pie chart
Circle diagram
Circle pie chart 2
Circle pie chart 1
Ring chart 1 - 3 elements
Ring chart 1 - 4 elements
Ring chart 1 - 5 elements
Ring chart 1 - 6 elements
Ring chart 1 - 7 elements
Ring chart 2 - 3 elements
Ring chart 2 - 4 elements
Ring chart 2 - 5 elements
Ring chart 2 - 6 elements
Ring chart 2 - 7 elements
Crystal diagram - 3 elements
Crystal diagram - 4 elements
Crystal diagram - 5 elements
Crystal diagram - 6 elements
Crystal diagram - 7 elements
Stacked Venn diagram - 4
Stacked Venn diagram - 5
Stacked Venn diagram - 6
Stacked Venn diagram - 7
Basic loop diagram
Block loop diagram
Arrow loop circle
Arrow loop - 3 circles
Arrow loop - 4 circles
Arrow loop - 5 circles
Arrow loop - 6 circles
Arrow loop - 7 circles
Arrow circle diagram - 3
Arrow circle diagram - 4
Stacked Venn diagram - 3
Arrow circle diagram - 5
Arrow circle diagram - 6
Arrow circle diagram - 7
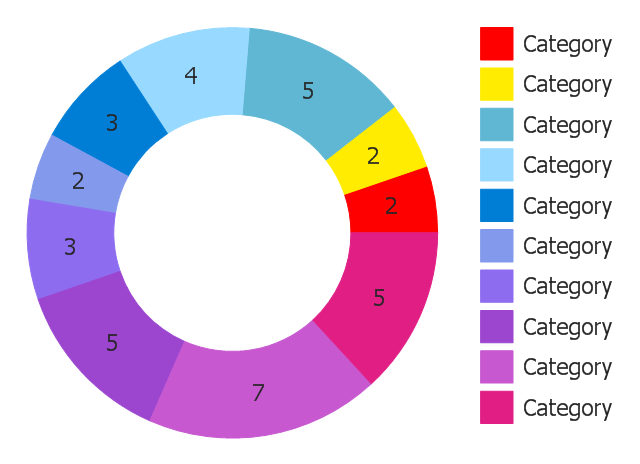
You can use this ring chart template in the ConceptDraw PRO diagramming and vector drawing software to add ring (doughnut, donut) charts to your websites, business documents, presentation slides and infographics.
"A doughnut chart (also spelled donut) is functionally identical to a pie chart, with the exception of a blank center and the ability to support multiple statistics as one." [Pie chart. Wikipedia]
The template "Ring chart" is included in the Pie Charts solution of the Graphs and Charts area in ConceptDraw Solution Park.
Donut chart
This cycle diagram sample was created on the base of the figure illustrating the article "Environmental Materials" by Cris Arnold from the website of the UK Centre for Materials Education of the Higher Education Academy. "The figure ... schematically shows how the disparate areas under the heading of 'environmental materials' can be linked via a life cycle analysis approach. ...
Life Cycle Analysis.
Life Cycle Analysis is essentially a method of considering the entire environmental impact, energy and resource usage of a material or product. It is often known as a 'cradle-to-grave' analysis and can encompass the entire lifetime from extraction to end-of-life disposal. Life cycle analysis can be an extremely effective way of linking many different aspects of the environmental impacts of materials usage. ...
Materials Extraction and Resource Implications.
The environmental impact of raw materials extraction and processing together with global resource issues provides a good place to start consideration of environmental aspects of materials. ...
Environmental Impacts of Processing.
... Topics that would come under this subject area include the specific environmental problems associated with processing of metals, polymers, ceramics, composites etc, and how these problems can be overcome.
Design for Sustainability.
This area ... will ... cover issues such as design for successful recycling, waste minimisation, energy efficiency and increased lifetime.
Economic, Social and Legislative Issues.
... For example, materials selection within the automotive industry is now heavily influenced by 'end-of-life vehicle' and 'hazardous material' regulations.
Use of Sustainable Materials.
... It is probably sensible to define such materials as those that have distinct differences that achieve environmental benefit compared to conventional materials. With this definition, the list would include:
(1) Materials of a significantly plant-based nature, including wood, natural fibre composites, natural polymers.
(2) Materials produced using a large proportion of waste material, including recycled polymers, composites made from waste mineral powders, and arguably also much steel and aluminium.
Materials for Green Energy.
The most exciting developments in Materials Science are in the realm of functional materials, and many of these serve an environmentally-beneficial purpose, particularly in the production of green energy.
These include:
(1) Solar-cell materials.
(2) Fuel-cell technology.
(3) Catalytic pollution control.
End-of-Life Issues.
The treatment of materials at the end of their lifetime is a significant subject area and encompasses aspects such as recycling techniques and materials limitations, biodegradabilty and composting, chemical recovery and energy recovery." [materials.ac.uk/ guides/ environmental.asp]
The ring chart example "Life cycle analysis" was created using the ConceptDraw PRO diagramming and vector drawing software extended with the Target and Circular Diagrams solution from the Marketing area of ConceptDraw Solution Park.
www.conceptdraw.com/ solution-park/ marketing-target-and-circular-diagrams
Ring chart

- How to Draw the Different Types of Pie Charts | Pie charts - Vector ...
- Arrow circle chart - Template | Donut chart - Template | Pie charts ...
- National Preparedness Cycle - Arrow ring chart | Circular diagrams ...
- How to Draw the Different Types of Pie Charts | Circular arrows ...
- Pie charts - Vector stencils library
- How to Create a Pie Chart | Circular arrows diagrams - Vector ...
- Life cycle analysis - Ring chart | Pie Chart Of Environmental Problems
- 2 3 Pie Chart
- Pie Chart Software | Basic Pie Charts | Circular diagrams - Vector ...
- How to Draw the Different Types of Pie Charts | How To Create a ...
- ERD | Entity Relationship Diagrams, ERD Software for Mac and Win
- Flowchart | Basic Flowchart Symbols and Meaning
- Flowchart | Flowchart Design - Symbols, Shapes, Stencils and Icons
- Flowchart | Flow Chart Symbols
- Electrical | Electrical Drawing - Wiring and Circuits Schematics
- Flowchart | Common Flowchart Symbols
- Flowchart | Common Flowchart Symbols