 Pie Charts
Pie Charts are extensively used in statistics and business for explaining data and work results, in mass media for comparison (i.e. to visualize the percentage for the parts of one total), and in many other fields. The Pie Charts solution for ConceptDraw PRO v10 offers powerful drawing tools, varied templates, samples, and a library of vector stencils for simple construction and design of Pie Charts, Donut Chart, and Pie Graph Worksheets.
 Plant Layout Plans
This solution extends ConceptDraw PRO v.9.5 plant layout software (or later) with process plant layout and piping design samples, templates and libraries of vector stencils for drawing Plant Layout plans. Use it to develop plant layouts, power plant desig
 Basic Pie Charts
This solution extends the capabilities of ConceptDraw PRO v10.3.0 (or later) with templates, samples, and a library of vector stencils for drawing pie and donut charts.
 ConceptDraw Solution Park
ConceptDraw Solution Park collects graphic extensions, examples and learning materials
This pie chart sample shows the atmosphere air composition. It was designed on the base of the Wikimedia Commons file: Air composition pie chart.JPG.
[commons.wikimedia.org/ wiki/ File:Air_ composition_ pie_ chart.JPG]
This file is licensed under the Creative Commons Attribution-Share Alike 3.0 Unported license. [creativecommons.org/ licenses/ by-sa/ 3.0/ deed.en]
"The atmosphere of Earth is a layer of gases surrounding the planet Earth that is retained by Earth's gravity. The atmosphere protects life on Earth by absorbing ultraviolet solar radiation, warming the surface through heat retention (greenhouse effect), and reducing temperature extremes between day and night (the diurnal temperature variation).
The common name given to the atmospheric gases used in breathing and photosynthesis is air. By volume, dry air contains 78.09% nitrogen, 20.95% oxygen, 0.93% argon, 0.039% carbon dioxide, and small amounts of other gases. Air also contains a variable amount of water vapor, on average around 1%. Although air content and atmospheric pressure vary at different layers, air suitable for the survival of terrestrial plants and terrestrial animals currently is only known to be found in Earth's troposphere and artificial atmospheres." [Atmosphere of Earth. Wikipedia]
The pie chart example "Atmosphere air composition" was created using the ConceptDraw PRO diagramming and vector drawing software extended with the Pie Charts solution of the Graphs and Charts area in ConceptDraw Solution Park.
Pie chart

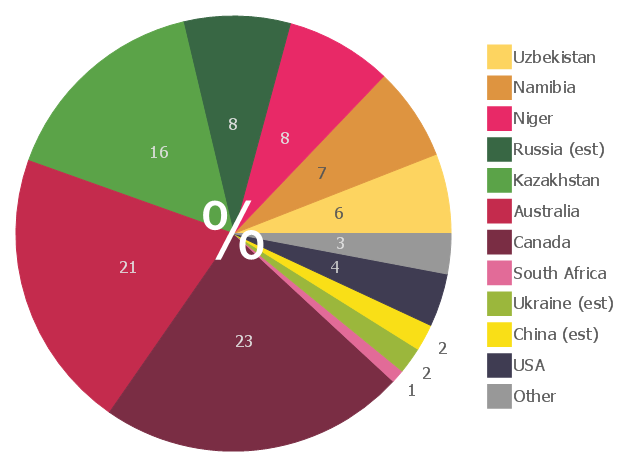
This pie chart sample shows the 2007 world uranium mining by countries.
It was designed on the base of the Wikimedia Commons file: 2007Uranium.PNG.[commons.wikimedia.org/ wiki/ File:2007Uranium.PNG]
This file is licensed under the Creative Commons Attribution 3.0 Unported license. [creativecommons.org/ licenses/ by/ 3.0/ deed.en]
"Uranium mining is the process of extraction of uranium ore from the ground. The worldwide production of uranium in 2009 amounted to 50,572 tonnes. Kazakhstan, Canada, and Australia are the top three producers and together account for 63% of world uranium production. Other important uranium producing countries in excess of 1,000 tons per year are Namibia, Russia, Niger, Uzbekistan, and the United States.
Uranium ores are normally processed by grinding the ore materials to a uniform particle size and then treating the ore to extract the uranium by chemical leaching. The milling process commonly yields dry powder-form material consisting of natural uranium, "yellowcake," which is sold on the uranium market as U3O8.
A prominent use of uranium from mining is as fuel for nuclear power plants." [Uranium mining. Wikipedia]
The pie chart example "2007 World uranium mining" was created using the ConceptDraw PRO diagramming and vector drawing software extended with the Pie Charts solution of the Graphs and Charts area in ConceptDraw Solution Park.
Pie chart
 Audit Flowcharts
Audit flowcharts solution extends ConceptDraw PRO software with templates, samples and library of vector stencils for drawing the audit and fiscal flow charts.
Basic Diagramming


Flow Chart Symbols

Basic Diagramming

 Value Stream Mapping
Value stream mapping solution extends ConceptDraw PRO software with templates, samples and vector stencils for drawing the Value Stream Maps (VSM) in lean manufacturing practice.
 Area Charts
Area Charts are used to display the cumulative totals over time using numbers or percentages; or to show trends over time among related attributes. The Area Chart is effective when comparing two or more quantities. Each series of data is typically represented with a different color, the use of color transparency in an object’s transparency shows overlapped areas and smaller areas hidden behind larger areas.
Process Flowchart


 School and Training Plans
Planning a school and its campus layout needs to depict the premises, represent internal spaces, location of windows and direction of natural light. Detailed classroom seating chart helps you visualize location of the blackboard and desks, taking into account the specifics of the room and its lighting, with a goal to design the classroom to be comfortable for each pupil and teacher.
- Pie Charts | ConceptDraw Solution Park | Plant Layout Plans | Plant ...
- Plant Layout Plans | Organizational Charts | Pie Charts | Example Of ...
- Plant Layout Plans | Pie Chart On Warehouse System
- Plant Layout Plans | Illustrations Diagrams Pie Chart About Pollution
- Draw A Chart On Plant Layout
- Design elements - Stations | 2007 World uranium mining - Pie chart ...
- Bar Diagram Math | Pie Chart Software | Best Diagramming Software ...
- Pie Chart Examples and Templates | Pyramid Diagram and Pyramid ...
- Circular Arrows Diagrams | Pie Diagram For Conservation Of Plants
- Bar Diagram Math | Process Diagrams | Percentage Pie Chart . Pie ...
- Competitor Analysis | Bubble Chart Maker | Pie Chart Software ...
- Bar Diagram Math | Pie Charts | Sketching Software | Management ...
- Hotel Plan. Hotel Plan Examples | Donut Chart Templates | Plant ...
- Organizational Charts | Order processing - EPC flow chart | Plant ...
- Pie Chart Of Computer In Business And Industry
- Pie Charts | How to Draw a Pie Chart Using ConceptDraw PRO ...
- How To use House Electrical Plan Software | Pie Chart Software ...
- Timeline Diagrams | Plant Layout Plans | Enterprise Architecture ...
- Plant Layout Plans | Process Flowchart | Bar Diagrams for Problem ...
- Design elements - Stations | Plant Layout Plans | How To use House ...
- ERD | Entity Relationship Diagrams, ERD Software for Mac and Win
- Flowchart | Basic Flowchart Symbols and Meaning
- Flowchart | Flowchart Design - Symbols, Shapes, Stencils and Icons
- Flowchart | Flow Chart Symbols
- Electrical | Electrical Drawing - Wiring and Circuits Schematics
- Flowchart | Common Flowchart Symbols
- Flowchart | Common Flowchart Symbols