"Time management is the .. process of planning and exercising conscious control over the amount of time spent on specific activities, especially to increase effectiveness, efficiency or productivity. Time management may be aided by a range of skills, tools, and techniques used to manage time when accomplishing specific tasks, projects, and goals complying with a due date. Initially, time management referred to just business or work activities, but eventually the term broadened to include personal activities as well. A time management system is a designed combination of processes, tools, techniques, and methods. Time management is usually a necessity in any project development as it determines the project completion time and scope." [Time management. Wikipedia]
This timetable pie chart shows the plan of daily actions and its durations in minutes.
It is useful visual tool of personal time management.
This schedule pie chart example was created using the ConceptDraw PRO diagramming and vector drawing software extended with the Target and Circular Diagrams solution from the Marketing area of ConceptDraw Solution Park.
www.conceptdraw.com/ solution-park/ marketing-target-and-circular-diagrams
Daily activities pie chart

Chart Examples

Chart Templates

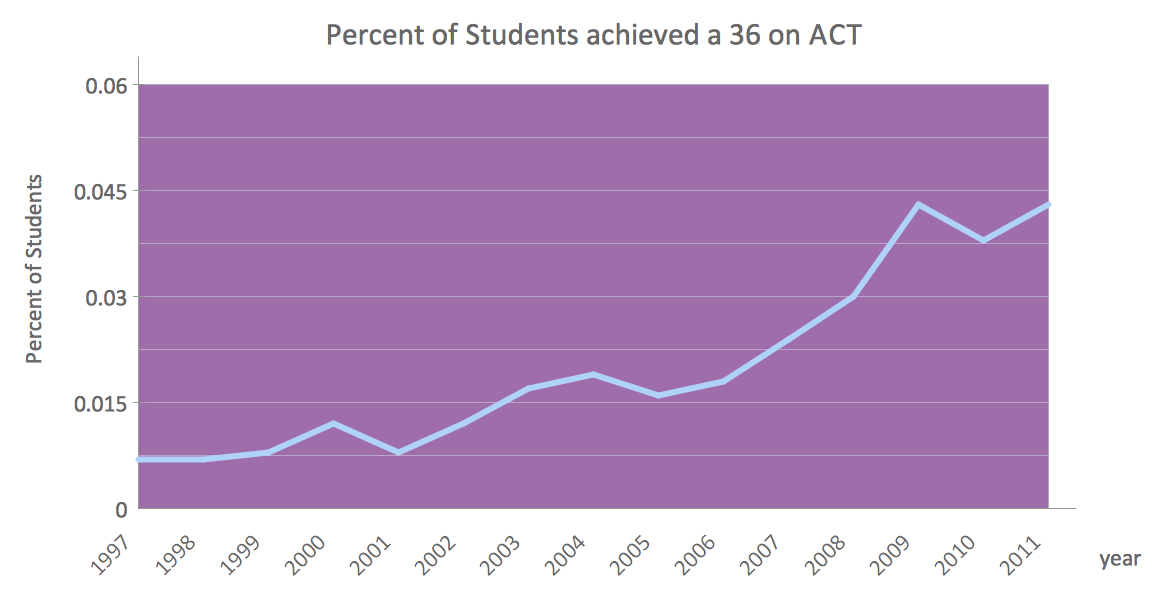
Line Chart Examples

SWOT Matrix

Line Chart Template for Word

This sample shows the Line Chart of annual percentage change. The Line Chart allows you to clearly see the changes of data over the time.
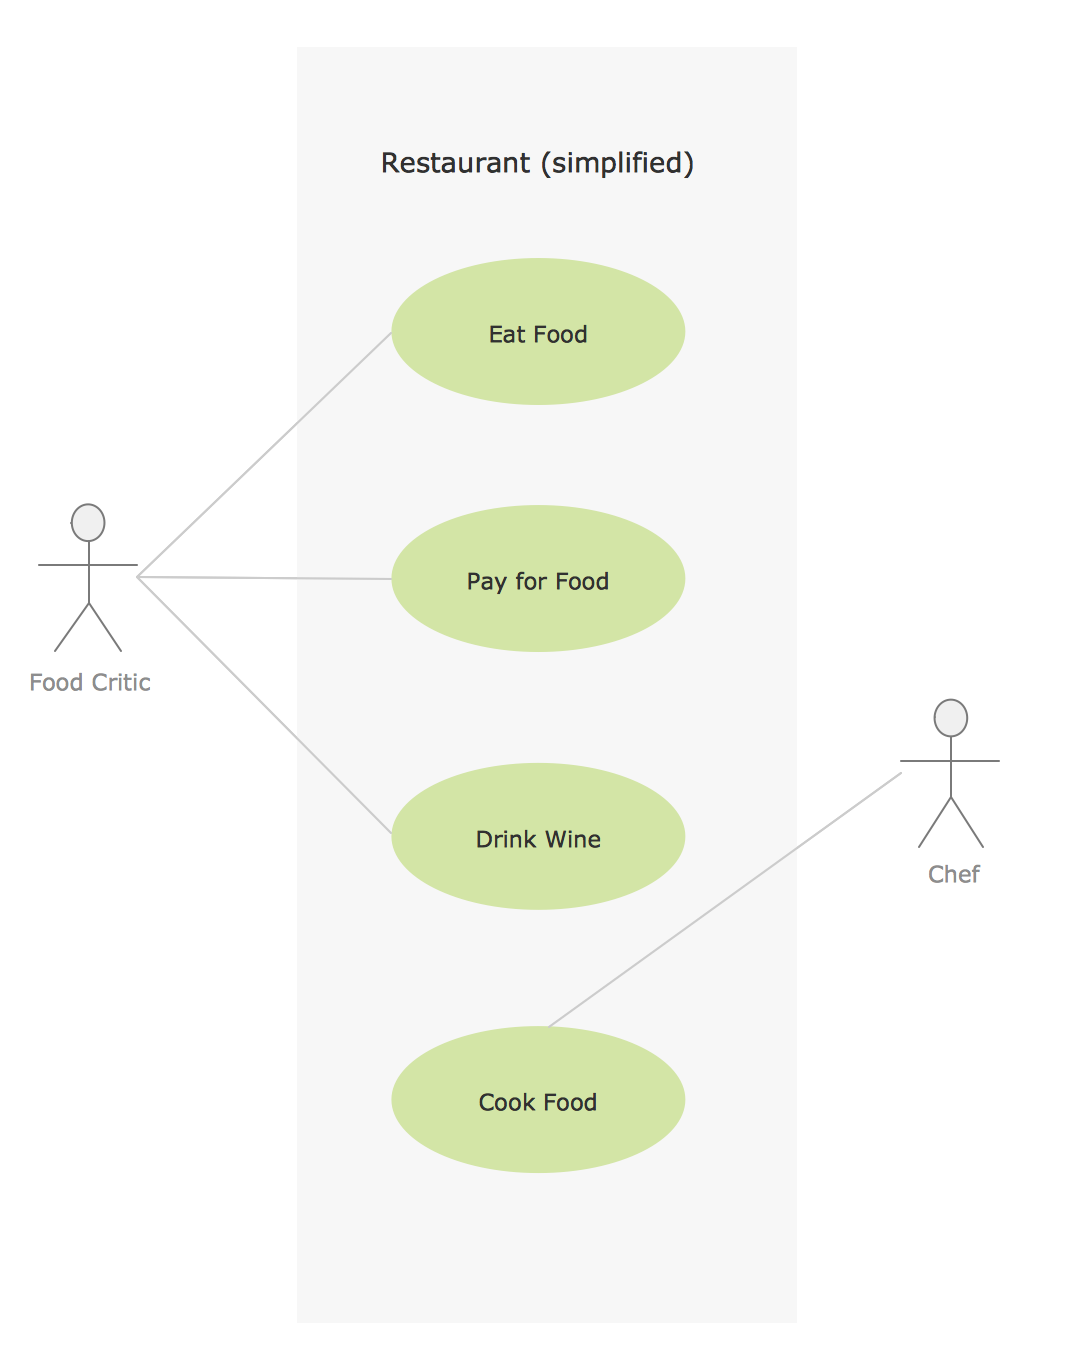
Sample for UML
Relative Value Chart Software

Relative values are widely used in:business, economics, investment, management, marketing, statistics, etc.
ConceptDraw DIAGRAM software is the best for drawing professional looking Relative Value Charts. ConceptDraw DIAGRAM provides Divided Bar Diagrams solution from the Graphs and Charts Area of ConceptDraw Solution Park.
Business Diagram Software


 Bar Graphs
The Bar Graphs solution enhances ConceptDraw DIAGRAM functionality with templates, numerous professional-looking samples, and a library of vector stencils for drawing different types of Bar Graphs, such as Simple Bar Graph, Double Bar Graph, Divided Bar Graph, Horizontal Bar Graph, Vertical Bar Graph, and Column Bar Chart.
Visual Presentations Made Easy with Diagramming Software


Line Charts
 Area Charts
Area Charts are used to display the cumulative totals over time using numbers or percentages; or to show trends over time among related attributes. The Area Chart is effective when comparing two or more quantities. Each series of data is typically represented with a different color, the use of color transparency in an object’s transparency shows overlapped areas and smaller areas hidden behind larger areas.
- Graphs Chart On The Daily Activities Of A Student
- Graph Chart About A Students Daily Activity
- Pie Chart Using Daily Activities Of A Student
- Schedule pie chart - Daily action plan | Chart Maker for ...
- Schedule pie chart - Daily action plan | Gant Chart in Project ...
- Circle Graph Sample Stident Daily Activity
- A Pie Chart Showing A Students Daily Activities
- Daily Activities On Student Graph
- A Graph On Daily Activities Of A Student
- Pie Graph Showing The Students Daily Routine
- Pie Graph For Daily Lives Of Students
- Pie Chart Student Daily Activities
- Schedule pie chart - Daily action plan | Program Evaluation and ...
- Graphs And Charts Student Daily Activities
- Schedule pie chart - Daily action plan | Workflow Diagram Template ...
- Schedule pie chart - Daily action plan | Think and act effectively ...
- Pie Chart Of Daily Activities Of A Student
- Schedule pie chart - Daily action plan | Process Flowchart | Basic ...
- Chart Daily Activities Of Student
- Example Of Activities In Pie Graph
- ERD | Entity Relationship Diagrams, ERD Software for Mac and Win
- Flowchart | Basic Flowchart Symbols and Meaning
- Flowchart | Flowchart Design - Symbols, Shapes, Stencils and Icons
- Flowchart | Flow Chart Symbols
- Electrical | Electrical Drawing - Wiring and Circuits Schematics
- Flowchart | Common Flowchart Symbols
- Flowchart | Common Flowchart Symbols