 Picture Graphs
Typically, a Picture Graph has very broad usage. They many times used successfully in marketing, management, and manufacturing. The Picture Graphs Solution extends the capabilities of ConceptDraw PRO v10 with templates, samples, and a library of professionally developed vector stencils for designing Picture Graphs.
Pictures of Graphs

Picture Graph

What Is a Picture Graph?

 ConceptDraw Solution Park
ConceptDraw Solution Park collects graphic extensions, examples and learning materials
The vector stencils library "Picture Graphs" contains templates of picture bar graphs for visual data comparison. Use these shapes to draw your pictorial bar charts in the ConceptDraw PRO diagramming and vector drawing software extended with the Picture Graphs solution from the Graphs and Charts area of ConceptDraw Solution Park.
Arrow picture graph (control dots)
Arrow picture graph (text -> height)
Picture graph (person)
-picture-graphs---vector-stencils-library.png--diagram-flowchart-example.png)
Picture graph (coins)
-picture-graphs---vector-stencils-library.png--diagram-flowchart-example.png)
HelpDesk
How to Create a Picture Graph in ConceptDraw PRO

Chart Maker for Presentations

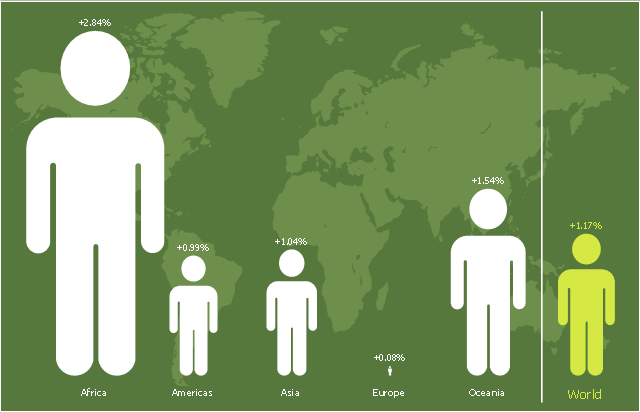
"Population growth' refers to the growth in human populations. Global population growth is around 80 million annually, or 1.2% p.a. The global population has grown from 1 billion in 1800 to 7 billion in 2012. It is expected to keep growing to reach 11 billion by the end of the century. Most of the growth occurs in the nations with the most poverty, showing the direct link between high population growth and low standards of living. The nations with high standards of living generally have low or zero rates of population growth. Australia's population growth is around 400,000 annually, or 1.8% p.a., which is nearly double the global average. It is caused mainly by very high immigration of around 200,000 p.a., the highest immigration rate in the world. Australia remains the only nation in the world with both high population growth and high standards of living." [Population growth. Wikipedia]
The pictorial chart example "Population growth by continent, 2010 - 2013" was created using the ConceptDraw PRO diagramming and vector drawing software extended with the Picture Graphs solution from the Graphs and Charts area of ConceptDraw Solution Park.
The pictorial chart example "Population growth by continent, 2010 - 2013" was created using the ConceptDraw PRO diagramming and vector drawing software extended with the Picture Graphs solution from the Graphs and Charts area of ConceptDraw Solution Park.
Image chart
This arrows bar chart example was drawn on the base of the infographics "Inside America's Economic Machine" from the website of the United States Census Bureau.
[census.gov/ how/ img/ Econ_ Infographic.jpg]
"The Advance Report on Durable Goods Manufacturer's Shipments, Inventories and Orders, or the Durable Goods Report, provides data on new orders received from more than 4,000 manufacturers of durable goods, which are generally defined as higher-priced capital goods orders with a useful life of three years or more, such as cars, semiconductor equipment and turbines.More than 85 industries are represented in the sample, which covers the entire United States." [Economic Indicators: Durable Goods Report. R. Barnes. investopedia.com/ university/ releases/ durablegoods.asp]
The arrow graph example "Total value of manufacturers' shipments" was created using the ConceptDraw PRO diagramming and vector drawing software extended with the Picture Graphs solution from the Graphs and Charts area of ConceptDraw Solution Park.
Arrows bar chart
 Bar Graphs
The Bar Graphs solution enhances ConceptDraw PRO v10 functionality with templates, numerous professional-looking samples, and a library of vector stencils for drawing different types of Bar Graphs, such as Simple Bar Graph, Double Bar Graph, Divided Bar Graph, Horizontal Bar Graph, Vertical Bar Graph, and Column Bar Chart.
 Line Graphs
How to draw a Line Graph with ease? The Line Graphs solution extends the capabilities of ConceptDraw PRO v10 with professionally designed templates, samples, and a library of vector stencils for drawing perfect Line Graphs.
Chart Software for Better Presentations

Graphs and Charts Area provide a wide collection of professional looking predesigned templates, samples and ready-to-use vector stencils that will help you to draw the charts and diagrams of various types: Pie Charts, Donut Charts, Line Charts, Column Charts, Bar Charts, Pyramids, Scatter Charts, Venn Diagrams, Spider Charts, Area Charts, Divided Bar Graphs.
 Value Stream Mapping
Value stream mapping solution extends ConceptDraw PRO software with templates, samples and vector stencils for drawing the Value Stream Maps (VSM) in lean manufacturing practice.
 AWS Architecture Diagrams
The flexible AWS cloud solutions will help you to create reliable applications with a high level of scaling in the AWS cloud, to run your applications and accelerate their work on the level of security. Besides AWS resources are available worldwide and yo
- Picture Graphs | How to Create a Picture Graph in ConceptDraw ...
- Bar Graphs | Line Graphs | Picture Graphs | Graphs
- Picture Graphs | Picture graphs - Vector stencils library | Picture ...
- How to Create a Picture Graph in ConceptDraw PRO | Picture ...
- Pictures of Graphs | Picture Graphs | How to Create a Picture Graph ...
- Design elements - Picture graphs | ConceptDraw Solution Park ...
- ConceptDraw Solution Park | Chart Software for Better Presentations ...
- Business and Finance | Picture Graphs | How to Create a Picture ...
- Picture Graphs
- Picture Graphs | ConceptDraw Solution Park | Graphs and Charts ...
- How to Create a Picture Graph in ConceptDraw PRO | Pictures of ...
- Barrie population - Picture bar graph | Picture graphs - Vector ...
- Barrie population - Picture bar graph | Picture Graphs | Picture ...
- Picture Graphs | Design elements - Picture graphs | Picture Graph ...
- Picture graph template | Design elements - Picture graphs | Graphs ...
- Computer Drawing Pic With Chart
- Design elements - Picture graphs
- Picture Graphs | ConceptDraw Solution Park | Group Collaboration ...
- Picture Graphs | Histograms | ConceptDraw Solution Park | The ...
- Pictures of Graphs | Food Pictures | Pictures of Food | Pict Page1 ...
- ERD | Entity Relationship Diagrams, ERD Software for Mac and Win
- Flowchart | Basic Flowchart Symbols and Meaning
- Flowchart | Flowchart Design - Symbols, Shapes, Stencils and Icons
- Flowchart | Flow Chart Symbols
- Electrical | Electrical Drawing - Wiring and Circuits Schematics
- Flowchart | Common Flowchart Symbols
- Flowchart | Common Flowchart Symbols