HelpDesk
How to Draw a Pictorial Chart

IDEF0 standard with ConceptDraw DIAGRAM

According to the IDEF0 standard any process can be described in the form of a block (Activity Box) which has inputs and outputs. The process consists in transformation of inputs into outputs under the influence of the management and in the presence of necessary resources. Outputs of the given process later on can be either inputs for the next process or resources, or management means.
Presenting Documents with Remote Presentation for Skype Solution

HelpDesk
How to Add a Block Diagram to a PowerPoint Presentation

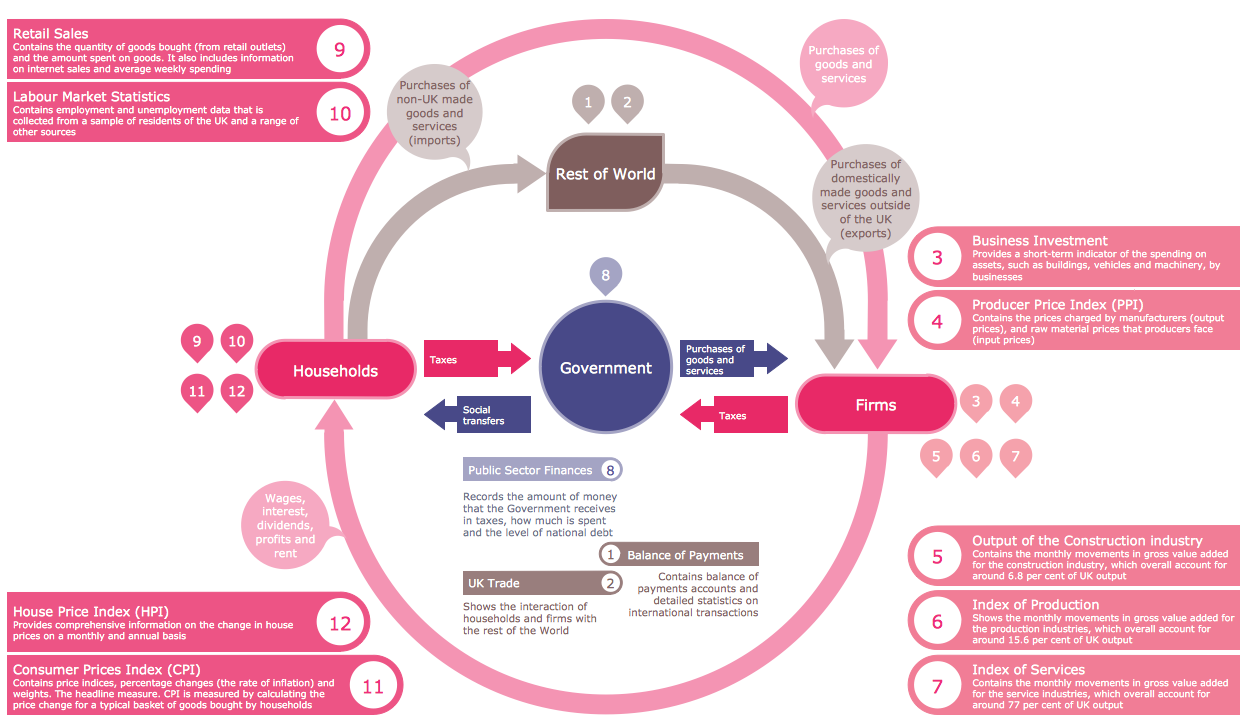
Pictorial Chart

Infographic Maker

Typography Font
Typography Font makes your Typography Infographic unique and attractive. ConceptDraw DIAGRAM extended with Typography Infographics Solution from the “Infographics” Area provides you the useful tools for simple and quick designing various Typography Infographics.
Design Pictorial Infographics. Design Infographics

Educational Technology Tools
 Presentation Clipart
Presentation design elements solution extends ConceptDraw DIAGRAM software with slide samples, templates and vector stencils libraries with design elements of presentation symbols, arrows, callouts, backgrounds, borders and frames, title blocks.
Sample Pictorial Chart. Sample Infographics

Use Pictorial Infographics solution to draw your own design pictorial infographics documents quick and easy.
 Presentation Exchange
This solution extends ConceptDraw MINDMAP software with the ability to import presentations from Microsoft PowerPoint, as well as enhancing its existing presentation capabilities.
Mesh Network Topology Diagram
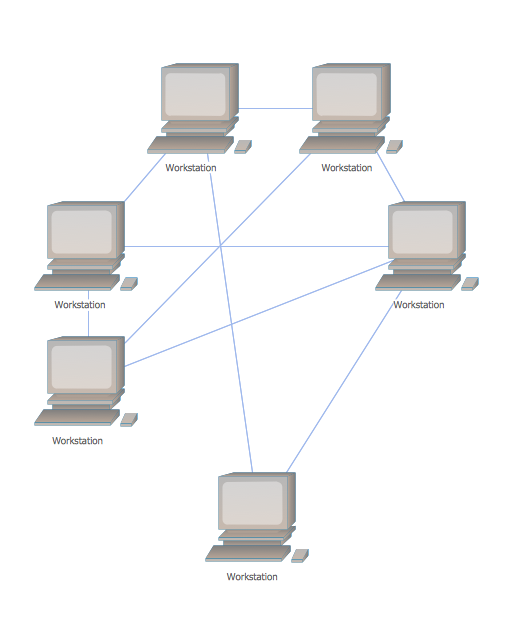
The Mesh Network Topology Diagram examples was created using ConceptDraw DIAGRAM software with Computer and Networks solution.
 Remote Presentation for Skype
This solution extends ConceptDraw MINDMAP software with the ability to collaborate via Skype.
- How To Make Pictorial Presentation On Chart
- Pictorial Presentation Of Flow Chart Symbols
- Pictorial Presentation Of Flowchart Symbols
- Pictorial Presentation And Information About A Mall Project Information
- Pictorial Chart | Pictorial concepts - Clip art | Remote Presentation ...
- Basic Flowchart Symbols and Meaning | Presentation Exchange ...
- How To Do Pictorial Presentation
- Pictorial Presentation For Security Camera
- Directions Maps | 3D pictorial street map | Design elements ...
- Tool And Equipment With Pictorial Presentation Chart
- How To Make Project Pictorial Presentation
- Pictorial concepts - Clip art | Arrows - Vector clipart library ...
- Best Pictorial Presentation Drawing Is
- How to make great presentation via Skype? ...how it works with ...
- Tools And Equipment With Pictorial Presentation Chart
- Pictorial Hr Presentations
- Presenting Documents with Remote Presentation for Skype Solution ...
- Chart Maker for Presentations | Chart Software for Better ...
- What Is a Picture Graph? | How to Create Presentation of Your ...
- How to Draw Pictorial Chart. How to Use Infograms | Process ...
- ERD | Entity Relationship Diagrams, ERD Software for Mac and Win
- Flowchart | Basic Flowchart Symbols and Meaning
- Flowchart | Flowchart Design - Symbols, Shapes, Stencils and Icons
- Flowchart | Flow Chart Symbols
- Electrical | Electrical Drawing - Wiring and Circuits Schematics
- Flowchart | Common Flowchart Symbols
- Flowchart | Common Flowchart Symbols