Basic Flowchart Symbols and Meaning
Flowchart Symbols and Meaning - Provides a visual representation of basic flowchart symbols and their proposed use in professional workflow diagram, standard process flow diagram and communicating the structure of a well-developed web site, as well as their correlation in developing on-line instructional projects. See flowchart's symbols by specifics of process flow diagram symbols and workflow diagram symbols.
Marketing Plan Infographic
You need design the Marketing Plan Infographic and dream to find the useful tools to draw it easier, quickly and effectively? ConceptDraw PRO offers the unique Marketing Infographics Solution from the Business Infographics Area that will help you!Educational Technology Tools
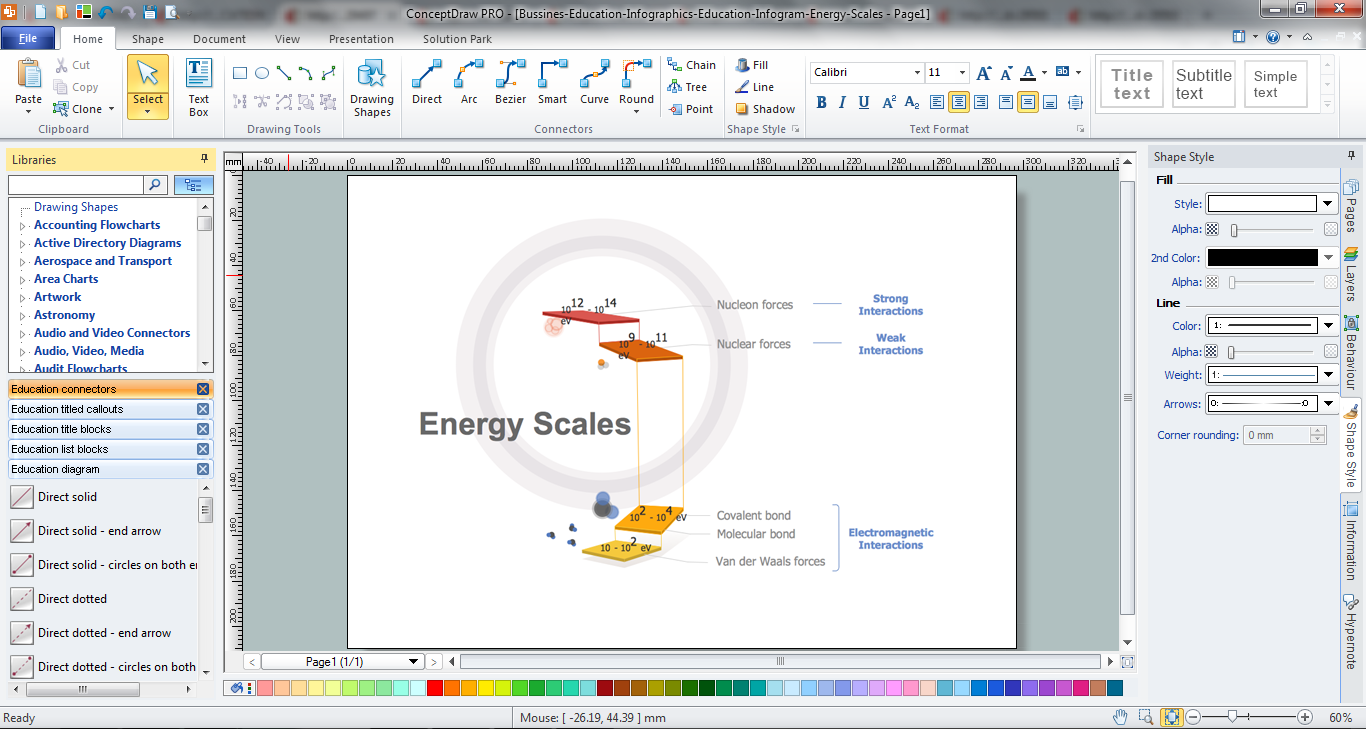
What are the favorite educational technology tools and techniques for teachers? Of course these are pictures, images and education infographics! ConceptDraw PRO software supplied with Education Infographics Solution from the Business Infographics Area provides powerful drawing tools to help design the education infographics of any complexity.Education Infographics
The Education Infographics are popular and effectively applied in the educational process. Now you don't need to be an artist to design colorful pictorial education infographics thanks to the unique drawing tools of Education Infographics Solution for ConceptDraw PRO diagramming and vector drawing software.How to Make an Infographic
How to Make an Infographic quick and easy? The perfect way is to use the ConceptDraw PRO diagramming and vector drawing software extended with Education Infographics Solution from the Business Infographics Area.
 Dashboards Area
Daily Infographic
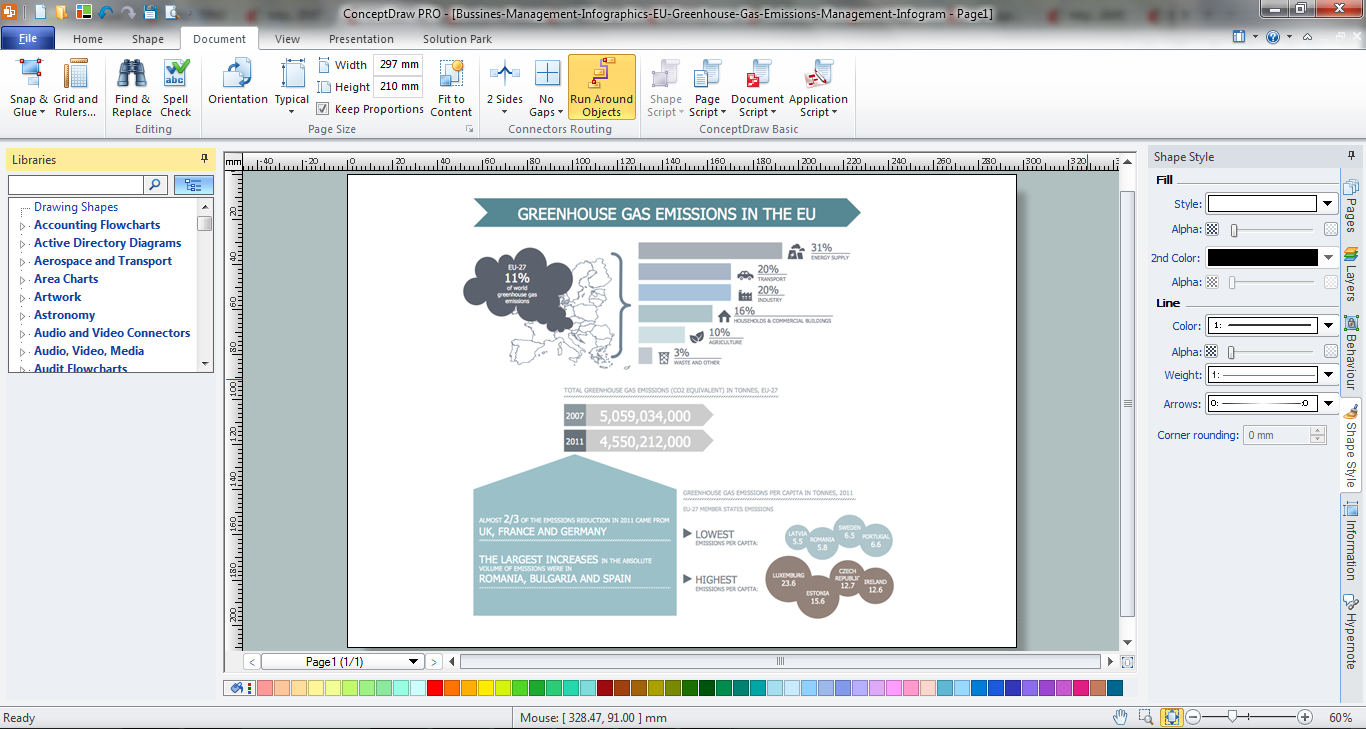
It's impossible to imagine our life without infographics! They are very popular in many fields of science, work and life activity. Management infographics, daily infographic are the good way for representing various information, complex knowledge in a visual comprehensive form. Try design them quick, easy and effective with new powerful Management Infographics Solution from the Business Infographics Area for ConceptDraw Solution Park.Management Tools
The science of the modern world does not stand still and is developing very fast.Day by day management specialists need the more effective and modern management tools. ConceptDraw PRO diagramming and vector drawing software provides the unique Management Infographics Solution from the Business Infographics Area with extensive management tools.
Make an Infographic
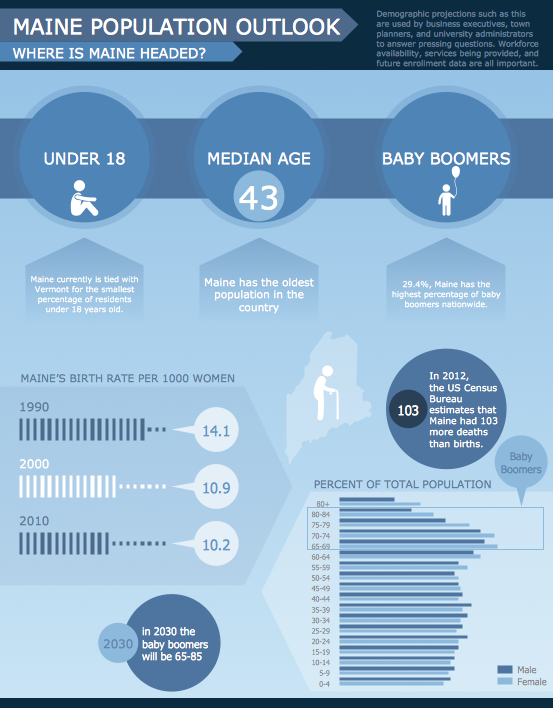
You want to make an infographic and need the useful and convenient drawing tools for this? In this case the ConceptDraw PRO software extended with Education Infographics Solution is a real godsend for you.Education Information
The Education Information is multifariuos and can be often represented in various forms. Еру the most successful ways of presentation the information and data are various illustrations, diagrams and colorful education infographics which you can easily make in ConceptDraw PRO software extended with Education Infographics Solution from the Business Infographics Area.
 Composition Dashboard
Management Consultant
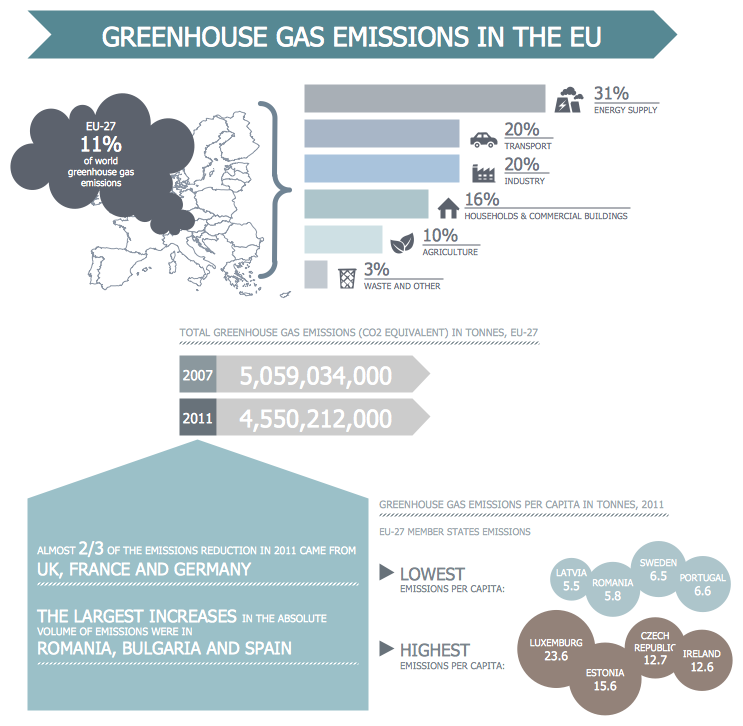
A management consultant is an important person for the company, he helps in the questions of improving business performance and increasing profits, he consults for the questions of business strategy, management and financial controls, resources, and also suggests recommendations for changing the structure of the company if needed.
So, every day management consultant conduct the complex work and often use the helpful management infographics for explain his thoughts and arguments to the company direction. Thanks to the development of computer technologies, drawing of management infographics is so easy today. ConceptDraw PRO diagramming and vector drawing software offers you the Management Infographics Solution from the Business Infographics Area.
 Meter Dashboard
 PM Dashboards
Social Media Marketing Infographic
How to create Social Media Marketing Infographic? It’s very easy! All that you need is a powerful marketing infographics software. Never before creation of Social Media Marketing Infographic wasn’t so easy as now with tools of Marketing Infographics Solution from the Business Infographics Area for ConceptDraw Solution Park.
 Comparison Dashboard
- 3D pictorial street map
- Design elements - 3D directional maps | Geo Map - USA ...
- 3D pictorial street map | 3D Directional map - Template | Conference ...
- Design elements - 3D directional maps | Map Directions | Directional ...
- Education infogram 5 - Template | Educational infogram 3 ...
- Directional Maps | ConceptDraw Solution Park | How to Create a ...
- Landmarks - Vector stencils library | ConceptDraw Solution Park ...
- Road signs - Vector stencils library | Transport map - Vector stencils ...
- The Pictorial Picture Bar Chart And Histogram
- UK Map | How to Create a Map Depicting the United Kingdom ...
- How to Create Education Infographics | Make an Infographic | How ...
- Design elements - Location map
- Status indicators - Vector stencils library | Road signs - Vector ...
- Sample Pictorial Chart. Sample Infographics | Examples Flowchart ...
- Office pictograms - Vector stencils library | Design elements - Office ...
- Road signs - Vector stencils library | Vehicular Networking ...
- Landmarks - Vector stencils library | Road signs - Vector stencils ...
- How to Draw a Natural Landscape | Drawing Illustration | Drawing ...
- Design elements - Shopping pictograms | Shopping pictograms ...
- Metro Map | How to draw Metro Map style infographics? (Moscow ...
- ERD | Entity Relationship Diagrams, ERD Software for Mac and Win
- Flowchart | Basic Flowchart Symbols and Meaning
- Flowchart | Flowchart Design - Symbols, Shapes, Stencils and Icons
- Flowchart | Flow Chart Symbols
- Electrical | Electrical Drawing - Wiring and Circuits Schematics
- Flowchart | Common Flowchart Symbols
- Flowchart | Common Flowchart Symbols


