 Basic Area Charts
This solution extends the capabilities of ConceptDraw DIAGRAM (or later) with templates, samples and a library of vector stencils for drawing Area Charts (area graphs) that visualize changes in values by filling in the area beneath the line connecting data points.
 Basic Picture Graphs
This solution extends the capabilities of ConceptDraw DIAGRAM (or later) with templates, samples and a library of vector stencils for drawing Picture Graphs.
 Area Charts
Area Charts are used to display the cumulative totals over time using numbers or percentages; or to show trends over time among related attributes. The Area Chart is effective when comparing two or more quantities. Each series of data is typically represented with a different color, the use of color transparency in an object’s transparency shows overlapped areas and smaller areas hidden behind larger areas.
 Picture Graphs
Typically, a Picture Graph has very broad usage. They many times used successfully in marketing, management, and manufacturing. The Picture Graphs Solution extends the capabilities of ConceptDraw DIAGRAM with templates, samples, and a library of professionally developed vector stencils for designing Picture Graphs.
HelpDesk
How to Create a Picture Graph

Geo Map — United States of America Map

ConceptDraw is idea to draw the geological map of the United States of America from the pre-designed vector geo map shapes.
Each map is scaled, with the option to add further levels of detail - county borders, their names, capitals and major cities can be shown or hidden using the action menu for each state map. ConceptDraw DIAGRAM gives you full control over map size, shading, color fills and alignment.
Use the Continent Maps solution for easy drawing professional looking geological maps, thematic maps, geospatial infographics and vector illustrations for your business documents, presentations and websites.
 Basic Line Graphs
This solution extends the capabilities of ConceptDraw DIAGRAM (or later) with templates, samples and a library of vector stencils for drawing Line Graphs.
Geo Map of Americas
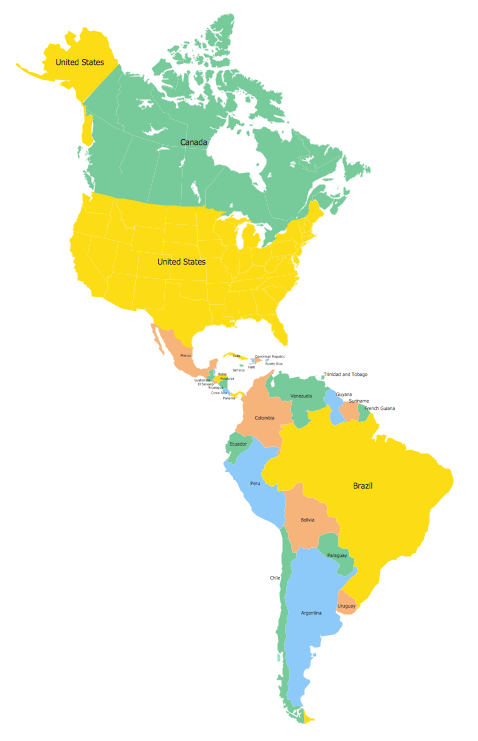
ConceptDraw is idea to draw the geological maps of America from the pre-designed vector geo map shapes and vector images map of america.
Use Continent Maps solution from the Maps area of ConceptDraw Solution Park to draw thematic maps, geospatial infographics and vector illustrations for your business documents, presentations and websites.
Business Report Pie. Pie Chart Examples

 Line Graphs
How to draw a Line Graph with ease? The Line Graphs solution extends the capabilities of ConceptDraw DIAGRAM with professionally designed templates, samples, and a library of vector stencils for drawing perfect Line Graphs.
 Histograms
How to make a Histogram? Making a Histogram is an incredibly easy process when it is done with ConceptDraw DIAGRAM. The Histograms Solution enhances ConceptDraw DIAGRAM functionality with extensive drawing tools, numerous samples, and examples; also a quick-start template and library of ready vector stencils for visualization the data and professional drawing Histograms.
 Education Package
Education Package is a comprehensive set of multifarious graphical solutions from ConceptDraw Solution Park, collected together in help to ConceptDraw DIAGRAM users working in a field of science, education and training, which is aimed at improving the quality of education and helping to design with ease variety of interesting and colorful educational materials, diagrams, charts and maps. Use it to present the information and knowledge in an interesting, clear, structured and simple form to achieve a success in education and pedagogy, to maintain the interest of students and pupils throughout the whole learning process, at the lectures, lessons and even during independent work with additional materials, to contribute to better perception of scientific information by listeners during the conferences and reports.
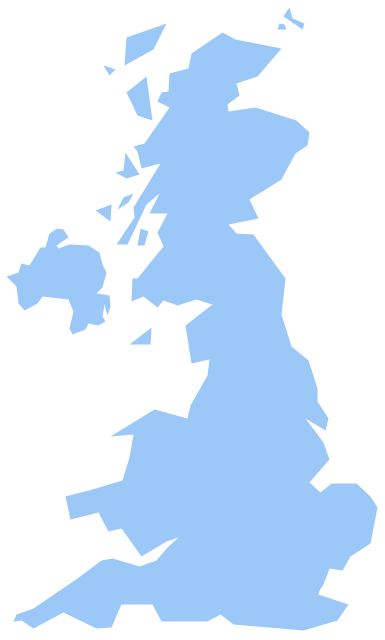
Geo Map - Europe - United Kingdom
 USA Maps
Use the USA Maps solution to create a map of USA, a US interstate map, printable US maps, US maps with cities and US maps with capitals. Create a complete USA states map.
- Pictorial Chart Of Over Population
- Line Graph | Line Chart Examples | Area Chart | Bar Graphs Of Over ...
- Overpopulation Charts And Graphs
- Line Graph | Line Chart Examples | Area Chart | Over Population ...
- Overpopulation Graph
- Graphs Of Overpopulation
- Graph Representing Population Growth Of Various Continents
- Graph Represenmting Population Growt Of Various Continents
- Flow Chart For Over Population
- Population growth by continent | Line Graph | Line Chart Examples ...
- Line Chart Examples | Basic Diagramming | Line Graph | Population ...
- Picture Graph | Picture Graphs | How to Create a Picture Graph in ...
- Under Population Line Graph Drawing
- Under Population Graphs And Chart
- Pictorial Chart | Pictogram Population Diagram
- Rainfall Bar Chart | Regional population growth from 2010 to 2016 ...
- Pictorial Bar Graph
- Bar Graph Of Population Growth Rate
- Picture Graphs | Picture Graph | How to Create a Picture Graph in ...
- Examples Of Graph Population
- ERD | Entity Relationship Diagrams, ERD Software for Mac and Win
- Flowchart | Basic Flowchart Symbols and Meaning
- Flowchart | Flowchart Design - Symbols, Shapes, Stencils and Icons
- Flowchart | Flow Chart Symbols
- Electrical | Electrical Drawing - Wiring and Circuits Schematics
- Flowchart | Common Flowchart Symbols
- Flowchart | Common Flowchart Symbols