HelpDesk
How to Draw a Pictorial Chart in ConceptDraw PRO

Process Flowchart


Sample Pictorial Chart. Sample Infographics
")
Use Pictorial Infographics solution to draw your own design pictorial infographics documents quick and easy.
How to Draw Pictorial Chart. How to Use Infograms

Pictorial Infographics solution contains large number of libraries with variety of predesigned vector pictograms that allows you design infographics in minutes. There are available 10 libraries with 197 vector pictograms.
Basic Flowchart Symbols and Meaning


Pictorial Chart

Design Pictorial Infographics. Design Infographics

 ConceptDraw Solution Park
ConceptDraw Solution Park collects graphic extensions, examples and learning materials
The vector stencils library "Picture Graphs" contains 35 templates of picture bar graphs for visual data comparison and time series.
Drag a template from the library to your document, set bars number, type category labels, select bars and enter your data.
Use these shapes to draw your pictorial bar charts in the ConceptDraw PRO diagramming and vector drawing software.
The vector stencils library "Picture Graphs" is included in the Picture Graphs solution from the Graphs and Charts area of ConceptDraw Solution Park.
Arrow
Water drop

Food

Grain

Agriculture

Medicines

Houses

Buildings

Money bags

Oil barrels

Natural gas

Electrical power

Nuclear power

Mechanical engineering

Chemical industry

Mining

Gold bars

Coins

Person

Men, women and children

Man

Woman

Child

Milk

Meat

Fruits

Vegetables

Computer

Mobile phone

Airliner

Car

Bus

Truck

Train

Cargo ship

This picture bar graph sample shows regional population growth from 2010 to 2016. It was designed using data from the Wikipedia article List of continents by population.
[en.wikipedia.org/ wiki/ List_ of_ continents_ by_ population]
"Population geography is a division of human geography. It is the study of the ways in which spatial variations in the distribution, composition, migration, and growth of populations are related to the nature of places. Population geography involves demography in a geographical perspective. It focuses on the characteristics of population distributions that change in a spatial context." [Population geography. Wikipedia]
The pictorial chart example "Regional population growth from 2010 to 2016" was created using the ConceptDraw PRO diagramming and vector drawing software extended with the Picture Graphs solution from the Graphs and Charts area of ConceptDraw Solution Park.
Image chart

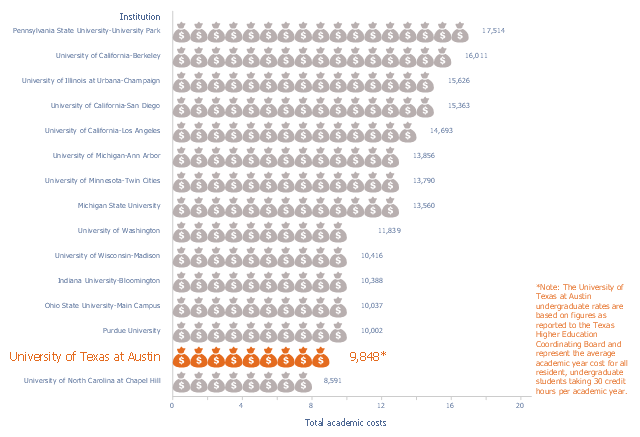
This picture bar graph sample shows the UT Austin Tuition Ranks 6th Compared to Other Texas Public Universities (Tuition and fees per semester, fall 2015). It was designed using data of the diagram "Compare UT Tuition" from the website of the University of Texas at Austin.
[tuition.utexas.edu/ compare]
The pictorial chart "Academic costs for residents, 2015-16" was created using the ConceptDraw PRO diagramming and vector drawing software extended with the Picture Graphs solution from the Graphs and Charts area of ConceptDraw Solution Park.
[tuition.utexas.edu/ compare]
The pictorial chart "Academic costs for residents, 2015-16" was created using the ConceptDraw PRO diagramming and vector drawing software extended with the Picture Graphs solution from the Graphs and Charts area of ConceptDraw Solution Park.
Pictorial chart
The vector stencils library "Picture bar graphs" contains 35 templates of pictorial charts. Use it for visualization of data comparison and time series with ConceptDraw PRO diagramming and vector drawing software.
"Pictorial bar graph.
Sometimes reffered to as a pictographs. A pictorial bar graph is a graph in which the rectangular bars have been filled with pictures, sketches, icons, etc. or where pictures, sketches, icons, etc. have been substituted for the rectangular bars. In both variations, one or more symbols might be used in each bar. The two major reasons for using pictorial graphs are to make the graph more appealing visually and to facilitate better communications." [Information Graphics: A Comprehensive Illustrated Reference. R. L. Harris. 1999. p.41]
The pictorial charts example "Design elements - Picture bar graphs" is included in the Picture Graphs solution from the Graphs and Charts area of ConceptDraw Solution Park.
Templates

This picture graph sample shows how does manufacturing compare with other industries in U.S. It was designed using data from the U.S. Census Bureau website. [census.gov/ how/ img/ manufacturing_ 2014_ th.jpg]
"Manufacturing is the production of merchandise for use or sale using labour and machines, tools, chemical and biological processing, or formulation. The term may refer to a range of human activity, from handicraft to high tech, but is most commonly applied to industrial production, in which raw materials are transformed into finished goods on a large scale. Such finished goods may be used for manufacturing other, more complex products, such as aircraft, household appliances or automobiles, or sold to wholesalers, who in turn sell them to retailers, who then sell them to end users and consumers." [Manufacturing. Wikipedia]
The arrows bar chart example "Manufacturing in America" was created using the ConceptDraw PRO diagramming and vector drawing software extended with the Picture Graphs solution from the Graphs and Charts area of ConceptDraw Solution Park.
Arrows bar chart

 Picture Graphs
Typically, a Picture Graph has very broad usage. They many times used successfully in marketing, management, and manufacturing. The Picture Graphs Solution extends the capabilities of ConceptDraw PRO v10 with templates, samples, and a library of professionally developed vector stencils for designing Picture Graphs.
Work Flow Process Chart

Information Graphics

Types of Flowcharts


Work Flow Chart

Infographic Software

- Bar Graphs | Picture Graphs | Line Graphs | Graphs
- Pyramid Diagram | Pyramid Diagram | 4 Level pyramid model ...
- How to Draw Pictorial Chart . How to Use Infograms | Process ...
- Line Graphs | Bar Graphs | Line Graph Charting Software | Graph
- Picture Graphs | Chart Maker for Presentations | Line Graphs ...
- How to Draw a Pictorial Chart in ConceptDraw PRO | How to Draw ...
- Picture Graphs | How to Create a Picture Graph in ConceptDraw ...
- Infographic Maker | How to Draw Pictorial Chart . How to Use ...
- Line Graph Charting Software
- Target and Circular Diagrams | Brand essence model - Wheel ...
- Create Graphs and Charts | How to Create a Line Chart | Line ...
- Line Graphs | Chart Maker for Presentations | Line Graph Charting
- How to Draw a Pictorial Chart in ConceptDraw PRO | Sample ...
- Image chart
- Design elements - Picture graphs | ConceptDraw Solution Park ...
- Sample Pictorial Chart . Sample Infographics | Examples Flowchart ...
- ConceptDraw Solution Park | How to Create a Bar Chart in ...
- How to Draw a Pictorial Chart in ConceptDraw PRO | Process ...
- ConceptDraw Solution Park | Target and Circular Diagrams ...
- Bar Diagrams for Problem Solving. Create event management bar ...
- ERD | Entity Relationship Diagrams, ERD Software for Mac and Win
- Flowchart | Basic Flowchart Symbols and Meaning
- Flowchart | Flowchart Design - Symbols, Shapes, Stencils and Icons
- Flowchart | Flow Chart Symbols
- Electrical | Electrical Drawing - Wiring and Circuits Schematics
- Flowchart | Common Flowchart Symbols
- Flowchart | Common Flowchart Symbols