Design Pictorial Infographics. Design Infographics

The vector stencils library "Medicine and health pictograms" contains 20 icons of medical and healthcare symbols.
Use it to draw your medical and healthcare infographics.
The example "Medicine and health pictograms - Vector stencils library" was created using the ConceptDraw PRO diagramming and vector drawing software extended with the Pictorial infographics solution from the area "What is infographics" in ConceptDraw Solution Park.
Awareness ribbon

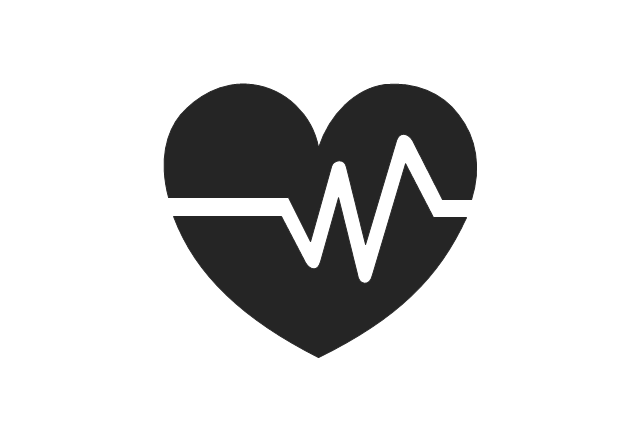
Cardiogram
Stethoscope

Calling an ambulance

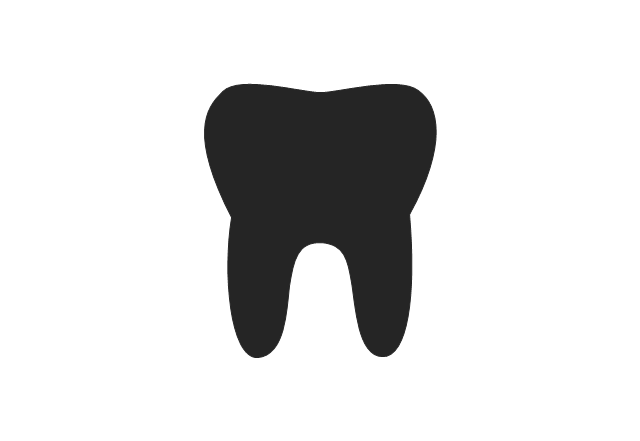
Tooth
DNA

First aid

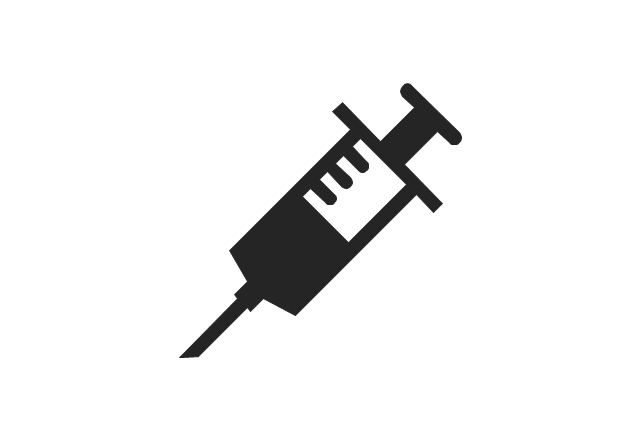
Syringe
Thermometer

Lungs

Medicament

Pills

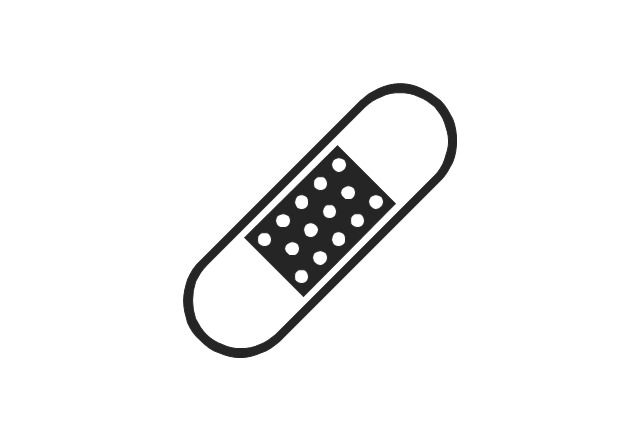
Patch
Stomach

Hospital

Dropper

Glasses

Case report

Crutches

Pharmacy

 Health Food
The Health Food solution contains the set of professionally designed samples and large collection of vector graphic libraries of healthy foods symbols of fruits, vegetables, herbs, nuts, beans, seafood, meat, dairy foods, drinks, which give powerful possi
 Food Court
Use the Food Court solution to create food art. Pictures of food can be designed using libraries of food images, fruit art and pictures of vegetables.
 Cooking Recipes
Create quick and easy recipe diagrams with the Cooking Recipes solution. Make a tasty meal for dinner, for holidays, or for a party.
 Bubble Diagrams
Bubble diagrams have enjoyed great success in software engineering, architecture, economics, medicine, landscape design, scientific and educational process, for ideas organization during brainstorming, for making business illustrations, presentations, planning, design, and strategy development. They are popular because of their simplicity and their powerful visual communication attributes.
 Circle-Spoke Diagrams
Examples of subject areas that are well suited to this approach are marketing, business, products promotion, process modeling, market, resource, time, and cost analysis. Circle-Spoke Diagrams are successfully used in presentations, conferences, management documents, magazines, reportages, reviews, reports, TV, and social media.
- Healthy Pictogram
- Medicine and health pictograms - Vector stencils library | Design ...
- Medicine and health pictograms - Vector stencils library | Medicine ...
- Design elements - Medicine and health pictograms | Medicine and ...
- Medicine and health pictograms - Vector stencils library | Healthy ...
- Design elements - Computer pictograms | Computer pictograms ...
- Health Related Pictograms
- Business people pictograms - Vector stencils library | Healthy Food ...
- Medicine and health pictograms - Vector stencils library | Process ...
- Medicine and health pictograms - Vector stencils library | Electrical ...
- Health Food | Education pictograms - Vector stencils library | Egg ...
- Health Food | Cooking Recipes | Winter Olympics pictograms ...
- Sign Making Software | Pictograms For Food Preparation Steps
- Electrical circuits - Vector stencils library | Medicine and health ...
- Medicine and health pictograms - Vector stencils library | Bathroom ...
- Medicine and health pictograms - Vector stencils library | Road ...
- Medicine and health pictograms - Vector stencils library | App icons ...
- How to Create Infographics that Help People Eat Healthy | Medicine ...
- HR symbols - Vector stencils library | Management pictograms ...
- Health Food | Social determinants of health | Health endpoint ...
- ERD | Entity Relationship Diagrams, ERD Software for Mac and Win
- Flowchart | Basic Flowchart Symbols and Meaning
- Flowchart | Flowchart Design - Symbols, Shapes, Stencils and Icons
- Flowchart | Flow Chart Symbols
- Electrical | Electrical Drawing - Wiring and Circuits Schematics
- Flowchart | Common Flowchart Symbols
- Flowchart | Common Flowchart Symbols