SWOT Matrix Template

UML Activity Diagram

Use ConceptDraw DIAGRAM diagramming and vector drawing software enhanced with Rapid UML solution from ConceptDraw Solution Park to create your own UML activity diagrams that show the business and operational workflows of components and overall flow of control in your systems. Such software provides coloring UML diagrams for various purposes and simplifying work of the engineers.
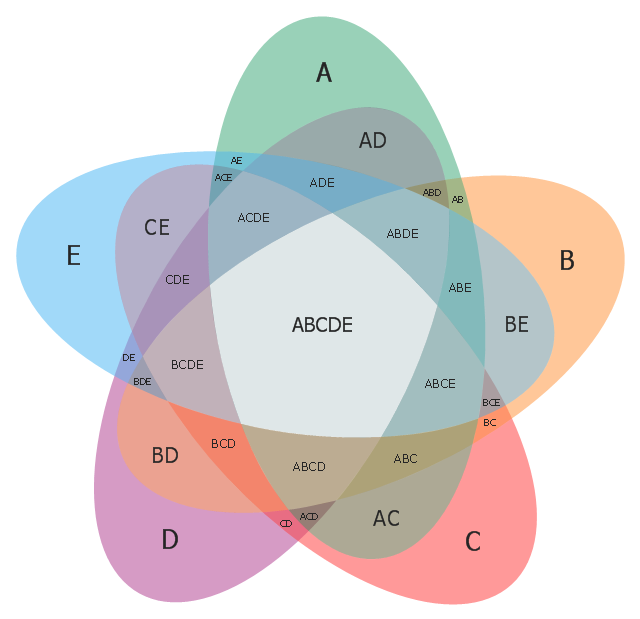
Use this template to design your five set Venn diagrams.
"Five-set Venn diagram using congruent ellipses in a radially symmetrical arrangement devised by Branko Grünbaum. Labels have been simplified for greater readability." [Venn diagram. Wikipedia]
The template "5-set Venn diagram" for the ConceptDraw PRO diagramming and vector drawing software is included in the Venn Diagrams solution from the area "What is a Diagram" of ConceptDraw Solution Park.
Template
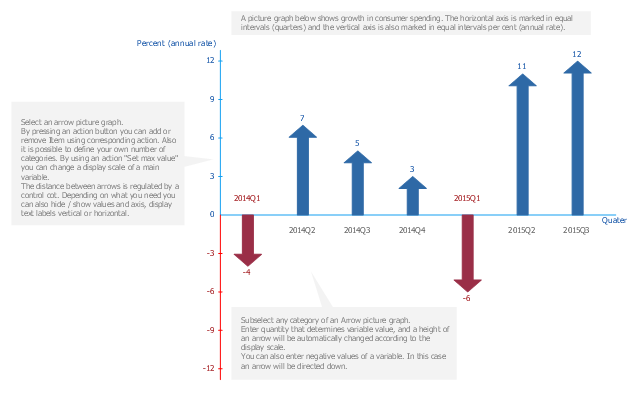
A picture chart (image chart, pictorial graph) is the type of a bar graph visualizing numarical data using symbols and pictograms.
In the field of economics and finance use a picture graph with columns in the form of coins. For population comparison statistics use a chart with columns in the form of manikins. To show data increase or decrease use arrows bar charts.
The arrow chart template "Picture graph" for the ConceptDraw PRO diagramming and vector drawing software is included in the Basic Picture Graphs solution from the Graphs and Charts area of ConceptDraw Solution Park.
Arrows bar graph template
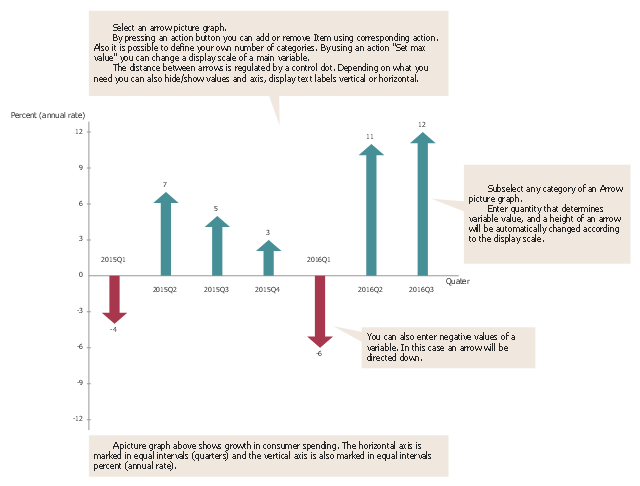
A picture chart (image chart, pictorial graph) is the type of a bar graph visualizing numarical data using symbols and pictograms.
In the field of economics and finance use a picture graph with columns in the form of coins. For population comparison statistics use a chart with columns in the form of manikins. To show data increase or decrease use arrows bar charts.
The picture graph template for the ConceptDraw PRO diagramming and vector drawing software is included in the Picture Graphs solution from the Graphs and Charts area of ConceptDraw Solution Park.
Arrows bar chart template
Design Element: Crows Foot for Entity Relationship Diagram - ERD

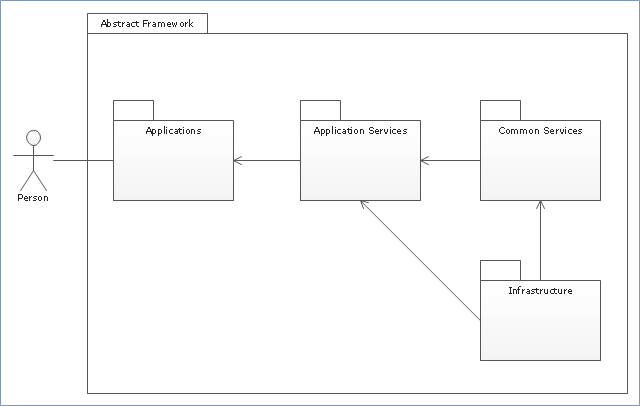
"Package diagram is UML structure diagram which shows packages and dependencies between the packages.
Model diagrams allow to show different views of a system, for example, as multi-layered (aka multi-tiered) application - multi-layered application model.
The following nodes and edges are typically drawn in a package diagram: package, packageable element, dependency, element import, package import, package merge." [uml-diagrams.org/ package-diagrams.html]
The template "UML package diagram" for the ConceptDraw PRO diagramming and vector drawing software is included in the Rapid UML solution from the Software Development area of ConceptDraw Solution Park.
www.conceptdraw.com/ solution-park/ software-uml
UML package diagram
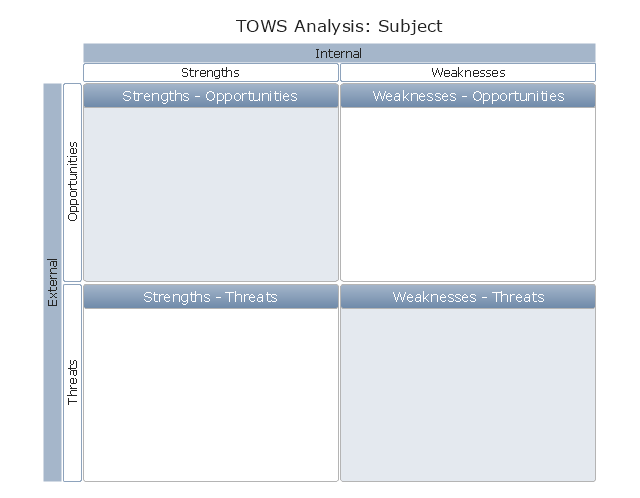
"The TOWS matrix ... serves as a conceptual framework for future research about the combination of external factors and those internal to the enterprise, and the strategies based on these variables.
Equally important, the matrix 'forces' practicing managers to analyze the situation of their company and to develop
strategies, tactics, and actions for the effective and efficient attainment of its organizational objectives and its mission." [usfca.edu/ fac_ staff/ weihrichh/ docs/ tows.pdf]
This TOWS analysis matrix diagram template for the ConceptDraw PRO diagramming and vector drawing software is included in the SWOT Analysis solution from the Management area of ConceptDraw Solution Park.
TOWS matrix template
"A swim lane (or swimlane) is a visual element used in process flow diagrams, or flowcharts, that visually distinguishes responsibilities for sub-processes of a business process. Swim lanes may be arranged either horizontally or vertically. In the accompanying example, the swimlanes are named Customer, Sales, Contracts, Legal, and Fulfillment, and are arranged vertically. ...
When used to diagram a business process that involves more than one department, swimlanes often serve to clarify not only the steps and who is responsible for each one, but also how delays, mistakes or cheating are most likely to occur.
Many process modeling methodologies utilize the concept of swimlanes, as a mechanism to organize activities into separate visual categories in order to illustrate different functional capabilities or responsibilities (organisational roles). Swimlanes are used in Business Process Modeling Notation (BPMN) and Unified Modeling Language activity diagram modeling methodologies." [Swim lane. Wikipedia]
The template "UML activity diagram (swimlanes)" for the ConceptDraw PRO diagramming and vector drawing software is included in the Rapid UML solution from the Software Development area of ConceptDraw Solution Park.
www.conceptdraw.com/ solution-park/ software-uml
UML activity diagram (swimlanes)
-uml-activity-diagram-(swimlanes)---template.png--diagram-flowchart-example.png)
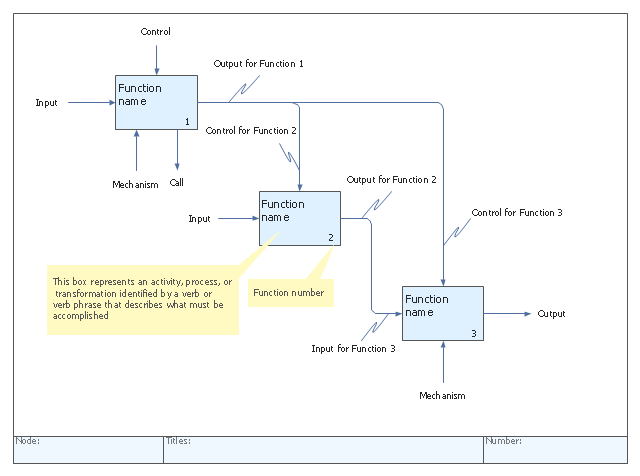
"IDEF0, a compound acronym (Icam DEFinition for Function Modeling, where 'ICAM' is an acronym for Integrated Computer Aided Manufacturing) is a function modeling methodology for describing manufacturing functions, which offers a functional modeling language for the analysis, development, reengineering, and integration of information systems; business processes; or software engineering analysis.
IDEF0 is part of the IDEF family of modeling languages in the field of software engineering, and is built on the functional modeling language Structured Analysis and Design Technique (SADT). ...
FIPS PUB 183 "Integration Definition for Function Modeling (IDEF0)," was withdrawn as a Federal Standard (in favor of OPEN Specifications and Standards) September 2, 2008, as cited in "The Federal Register", Volume 73, page 51276 (73FR/ 51276). ...
IDEF0, used to produce a "function model". A function model is a structured representation of the functions, activities or processes within the modeled system or subject area." [IDEF0. Wikipedia]
The template "IDEF0 diagram" is included in the IDEF0 Diagrams solution from the Software Development area of ConceptDraw Solution Park.
IDEF0 template
"Causes in the diagram are often categorized, such as to the 6 M's ...
The 6 Ms (used in manufacturing industry):
(1) Machine (technology);
(2) Method (process);
(3) Material (Includes Raw Material, Consumables and Information.);
(4) Man Power (physical work)/ Mind Power (brain work): Kaizens, Suggestions;
(5) Measurement (Inspection);
(6) Milieu/ Mother Nature (Environment).
The original 6Ms used by the Toyota Production System have been expanded by some to include the following and are referred to as the 8Ms. However, this is not globally recognized. It has been suggested to return to the roots of the tools and to keep the teaching simple while recognizing the original intent; most programs do not address the 8Ms.
(7) Management/ Money Power;
(8) Maintenance." [Ishikawa diagram. Wikipedia]
This 8Ms Ishikawa diagram (manufacturing cause and effect diagram) template is included in the Fishbone Diagram solution from the Management area of ConceptDraw Solution Park.
8Ms Ishikawa diagram

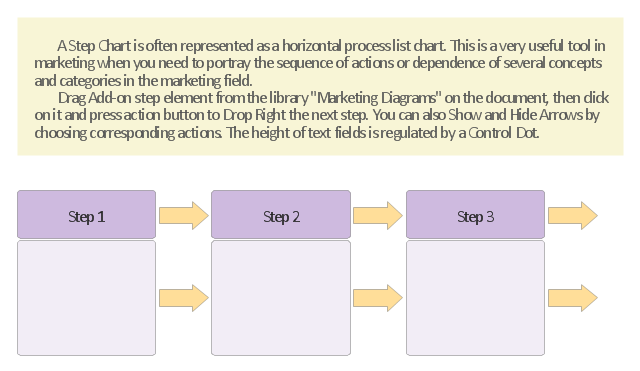
Step chart visualize a horizontal process list. It's used in marketing to portray the sequence of actions or dependence of several concepts and categories.
The step chart template for the ConceptDraw PRO diagramming and vector drawing software is included in the Block Diagrams solution from the area "What is a Diagram" of ConceptDraw Solution Park.
The step chart template for the ConceptDraw PRO diagramming and vector drawing software is included in the Block Diagrams solution from the area "What is a Diagram" of ConceptDraw Solution Park.
Step chart template
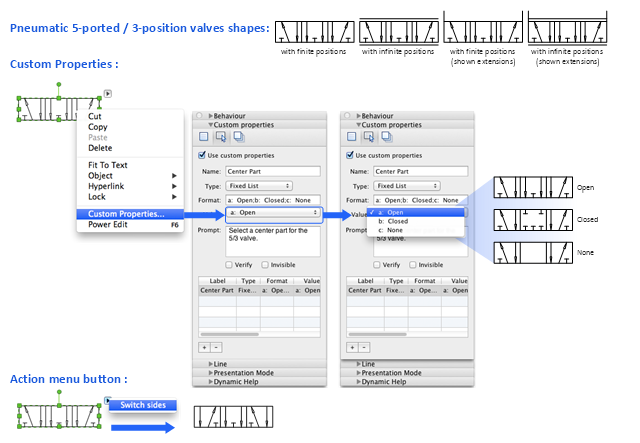
"Directional control valves are one of the most fundamental parts in hydraulic machinery as well and pneumatic machinery. They allow fluid flow into different paths from one or more sources. They usually consist of a spool inside a cylinder which is mechanically or electrically controlled. The movement of the spool restricts or permits the flow, thus it controls the fluid flow. ...
While working with layouts of hydraulic machinery it is cumbersome to draw actual picture of every valve and other components.instead of pictures symbols are used for variety of components in the hydraulic system to highlight the functional aspects. symbol for directional control valve is made of number of square boxes adjacent to each other depending on the number of positions.connections to the valve are shown on these squares by capital letters.usually they are named only in their normal position and not repeated in other positions.actuation system of the valve is also designated in its symbol." [Directional control valve. Wikipedia]
The Mac template "Pneumatic 5-ported 3-position valve" for the ConceptDraw PRO diagramming and vector drawing software is included in the Mechanical Engineering solution from the Engineering area of ConceptDraw Solution Park.
www.conceptdraw.com/ solution-park/ engineering-mechanical
Pneumatic directional control valve
Use this template of arrow circle chart (circle arrow diagram, segmented cycle diagram) in the ConceptDraw PRO diagramming and vector drawing software to visualize progression or continuing sequence of stages, tasks or events as circular flow.
The template "Arrow circle chart" is included in the Pie Charts solution of the Graphs and Charts area in ConceptDraw Solution Park.
The template "Arrow circle chart" is included in the Pie Charts solution of the Graphs and Charts area in ConceptDraw Solution Park.
Donut chart
- Pict Page1 Physical Lan And Wan Diagram Template Png Draw
- SWOT Matrix Template | UML Activity Diagram | Design Element ...
- Workflow diagrams - Vector stencils library | SWOT Matrix Template ...
- Bar Chart Template for Word | Example of DFD for Online Store ...
- SWOT Matrix Template | Design elements - Audit flowchart | Design ...
- Picture graph - Template
- Professional Photo Camera Pict
- Triangle scheme with arrows - Template | Circular Flow Diagram ...
- Picture graph - Template
- Picture Chart Templates
- Feature Comparison Chart Software | Bar Chart Template for Word ...
- Scatter graph - Template | Line graph - Template | Picture graph ...
- Responsibility assignment matrix - Central statistical office | Person ...
- Free Pict Time Vector
- Mechanical Drawing Symbols | Pneumatic 5-ported 3-position valve ...
- Picture Graphs | Picture Graph | How to Create a Picture Graph in ...
- Arrow circle chart - Template | Basic Flowchart Symbols and ...
- Template Or Pictures Of Money
- Management indicators - Vector stencils library | Management ...
- How to Create a Picture Graph in ConceptDraw PRO | Network ...
- ERD | Entity Relationship Diagrams, ERD Software for Mac and Win
- Flowchart | Basic Flowchart Symbols and Meaning
- Flowchart | Flowchart Design - Symbols, Shapes, Stencils and Icons
- Flowchart | Flow Chart Symbols
- Electrical | Electrical Drawing - Wiring and Circuits Schematics
- Flowchart | Common Flowchart Symbols
- Flowchart | Common Flowchart Symbols