Physics Diagrams
HelpDesk
How to Draw Physics Diagrams

 Physics
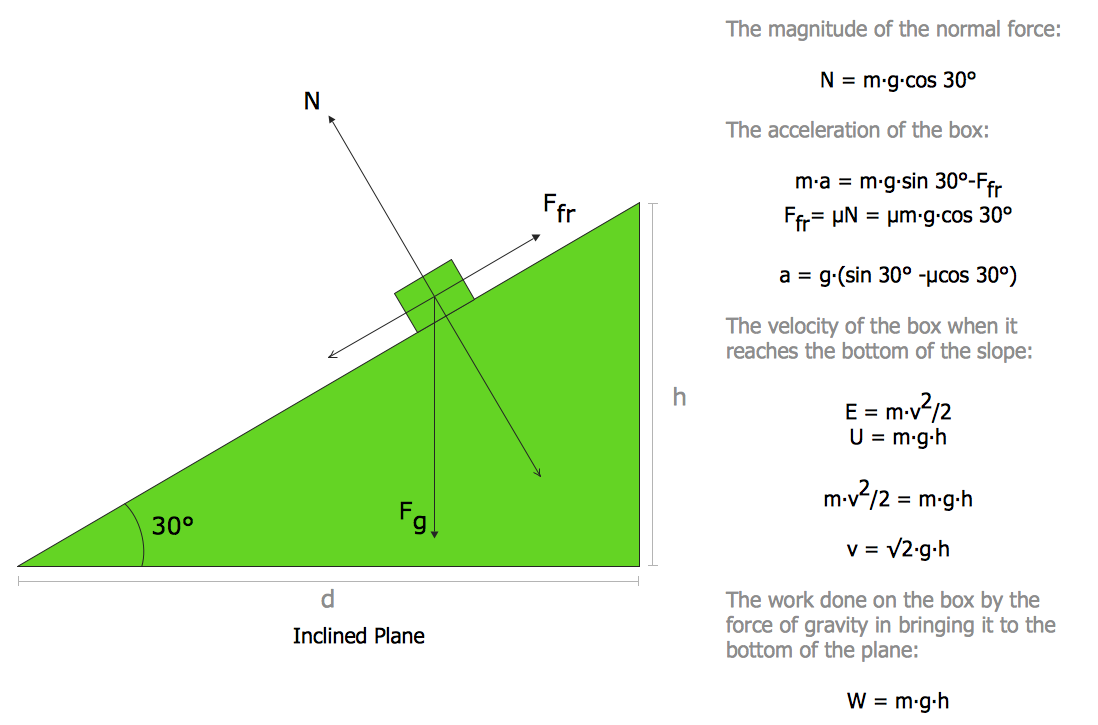
Physics solution extends ConceptDraw DIAGRAM software with templates, samples and libraries of vector stencils for drawing the physical illustrations, diagrams and charts.
Physics Symbols

Physics solution provides all tools that you can need for physics diagrams designing. It includes 3 libraries with predesigned vector physics symbols: Optics Library, Mechanics Library and Nuclear Physics Library.
BPMN 2.0

Process Flow Chart Symbols

It is incredibly convenient to use the ConceptDraw DIAGRAM software extended with Flowcharts Solution from the "Diagrams" Area of ConceptDraw Solution Park for designing professional looking Process Flow Charts.
Concept Map

How to draw a Concept Map quick, easy and effective? ConceptDraw DIAGRAM offers the unique Concept Maps Solution from the "Diagrams" Area that will help you!
Solar System Symbols
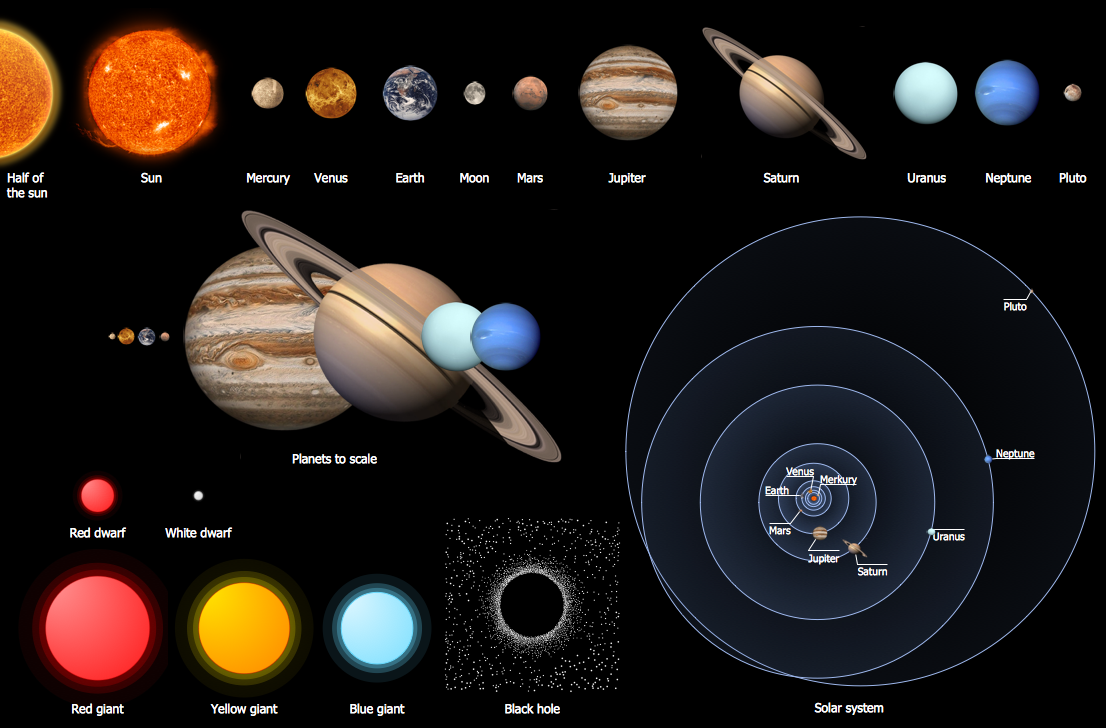
To quickly draw any astronomy illustration: create new document and simply drag the needed solar system symbols from the Stars and Planets library, arrange them and add the text. You can also use the predesigned templates and samples from the ConceptDraw STORE as the base for your own sun solar system illustrations, astronomy and astrology drawings.
Mathematics Symbols

Mathematics solution provides 3 libraries with predesigned vector mathematics symbols and figures:
Solid Geometry Library, Plane Geometry Library and Trigonometric Functions Library.
Line Chart Template for Word

This sample shows the Line Chart of annual percentage change. The Line Chart allows you to clearly see the changes of data over the time.
- Physics | IDEF0 Diagrams | How To Draw Physics Diagrams In Word
- Physics Diagrams | Mechanical Engineering | Uses And Diagram Of ...
- How to Draw Physics Diagrams in ConceptDraw PRO | Physics ...
- Physics Diagrams | How to Draw Physics Diagrams in ConceptDraw ...
- Free-body diagram | How to Draw Physics Diagrams in ...
- How to Draw Physics Diagrams in ConceptDraw PRO | Venn ...
- How to Draw Physics Diagrams in ConceptDraw PRO | Body ...
- How to Draw Physics Diagrams in ConceptDraw PRO | Free-body ...
- How to Draw Physics Diagrams in ConceptDraw PRO | Design ...
- Physics Diagrams | Organic Chemistry Symbols | Chart Software for ...
- ERD | Entity Relationship Diagrams, ERD Software for Mac and Win
- Flowchart | Basic Flowchart Symbols and Meaning
- Flowchart | Flowchart Design - Symbols, Shapes, Stencils and Icons
- Flowchart | Flow Chart Symbols
- Electrical | Electrical Drawing - Wiring and Circuits Schematics
- Flowchart | Common Flowchart Symbols
- Flowchart | Common Flowchart Symbols