PERT Chart

PERT Chart Software

ConceptDraw DIAGRAM is a powerful diagramming and vector drawing software for designing professional looking PERT Charts quick and easy.
Activity Network (PERT) Chart
 Chart *")
This diagram is constructed as part of the process in creating a schedule of corrective actions. The Activity Network Chart (PERT) shows the logical connections and consequence of tasks to be performed. It displays the time period for problem solving and the implementation of all activities through the critical path.
Program Evaluation and Review Technique (PERT) with ConceptDraw DIAGRAM
 with ConceptDraw DIAGRAM *")
CORRECTIVE ACTIONS PLANNING. PERT Chart

ConceptDraw Office suite is a software for corrective actions planning.

"A project network is a graph (flow chart) depicting the sequence in which a project's terminal elements are to be completed by showing terminal elements and their dependencies.
... the project network shows the "before-after" relations.
The most popular form of project network is activity on node, the other one is activity on arrow.
The condition for a valid project network is that it doesn't contain any circular references." [Project network. Wikipedia]
The PERT chart example "Project management plan" was created using the ConceptDraw PRO diagramming and vector drawing software extended with the solution "Seven Management and Planning Tools" from the Management area of ConceptDraw Solution Park.
PERT

Legend

Gantt chart examples

Activity Network Diagram Method

This sample shows the PERT (Program Evaluation Review Technique) chart of the request on proposal. A request for proposal (RFP) is a request of the company or the organization to potential suppliers to submit the business proposals for service or goods that it is interested to purchase. The RFP is represented on the initial procurement stage and allows to define the risks and benefits.
HelpDesk
How To Create a PERT Chart Using PM Easy Solution

How to Create Presentation of Your Project Gantt Chart

How to Discover Critical Path on a Gantt Chart

 Seven Management and Planning Tools
Seven Management and Planning Tools solution extends ConceptDraw DIAGRAM and ConceptDraw MINDMAP with features, templates, samples and libraries of vector stencils for drawing management mind maps and diagrams.
Gantt Chart Software

ConceptDraw PROJECT provides wide capabilities of importing and exporting in various formats: Microsoft Project, ConceptDraw MINDMAP , Mindjet MindManager, PDF file.
Timeline Examples

Critical Path Method in ConceptDraw PROJECT

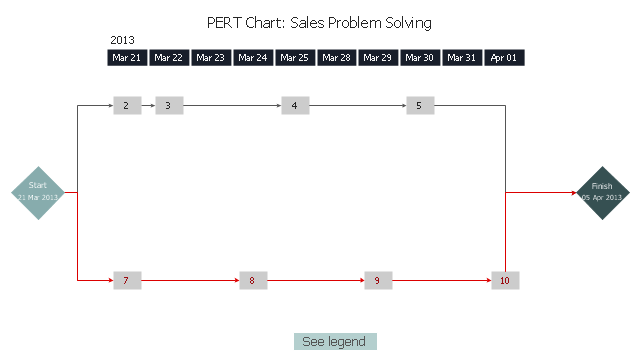
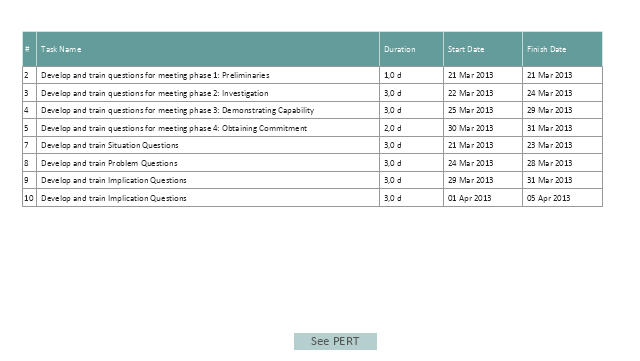
"Solution selling is a sales methodology. Rather than just promoting an existing product, the salesperson focuses on the customer's pain(s) and addresses the issue with his or her offerings (product and services). The resolution of the pain is what constitutes a "solution". ...
Followers of "solution-selling" generally apply a consultative sales approach to all aspects of their sales process (or during a sales cycle) including:
Prospecting;
Diagnosing customer needs;
Crafting a potential solution;
Establishing value;
Bargaining for access to decision-makers;
Positioning proof, ROI and the total solution;
Negotiating a win-win solution;
Following up to ensure customer success.
The solution selling methodology has evolved as key components of professional selling evolve. As a result, solution selling has become more broadly defined - to include dimensions of "sales process", "competitive selling", "value selling" as well as "consultative selling" or "complex selling" which set the focus on the team's aspects of the sales." [Solution selling.Wikipedia]
The PERT chart example "Sale problem solution" was created using the ConceptDraw PRO diagramming and vector drawing software extended with the solution Seven Management and Planning Tools from the Management area of ConceptDraw Solution Park.
PERT
Legend
How to Report Task's Execution with Gantt Chart

How To Create a Flow Chart in ConceptDraw

Put an initial object from library to a page and use RapidDraw technology clicking on direction arrows to add new objects to the flowchart. This way you can make flowchart quickly.
Bar Diagrams for Problem Solving. Create economics and financial bar charts with Bar Graphs Solution

How to Create Gantt Chart

- Pert Chart Project Examples
- How To Create a PERT Chart | How to Create Project Diagrams on ...
- PERT chart - Project management plan | Example Of Pert In ...
- How To Create a PERT Chart Using PM Easy Solution | Business ...
- Project Management Pert Chart
- PERT chart - Sale problem solution | How To Create a PERT Chart ...
- How To Create a PERT Chart | Gantt charts for planning and ...
- Pert Chart
- PERT chart - Project management plan | PERT chart - Template ...
- PERT chart - Project management plan | PERT chart - Template | PM ...
- Gantt Chart And Pert Chart In Software Engineering With Example
- PERT chart - Project management plan | Network Diagramming ...
- PERT Chart Software | Activity Network ( PERT ) Chart | PM Easy ...
- PERT chart - Project management plan | Project — Working With ...
- PERT chart - Template | PERT chart - Project management plan ...
- Activity Network ( PERT ) Chart | Activity Network Diagram Method ...
- Project Management Charts And Graphs
- PERT chart - Project management plan | How to Create Project ...
- How To Create a PERT Chart | Pert Example With Solution
- PERT chart - Template | PROBLEM ANALYSIS. Prioritization Matrix ...
- ERD | Entity Relationship Diagrams, ERD Software for Mac and Win
- Flowchart | Basic Flowchart Symbols and Meaning
- Flowchart | Flowchart Design - Symbols, Shapes, Stencils and Icons
- Flowchart | Flow Chart Symbols
- Electrical | Electrical Drawing - Wiring and Circuits Schematics
- Flowchart | Common Flowchart Symbols
- Flowchart | Common Flowchart Symbols