Program Evaluation and Review Technique (PERT) with ConceptDraw DIAGRAM
PERT Diagram is a more realistic approach of a project's time estimate analysis. After PERT chart was constructed user can discover the shortest possible duration for entire project timescale. The project timeline is the longest chain that might be taken with connected tasks on the PERT Diagram. Completion of serial tasks need to be accomplished in a presented order. At a project timeline can be independent tasks that not linked with main sequence they are called parallel tasks. PERT diagram is more suitable for Critical Path Analysis than Gantt chart for the reason that it undoubtedly better determine task dependencies. Project managers customarily utilize both methodologies.
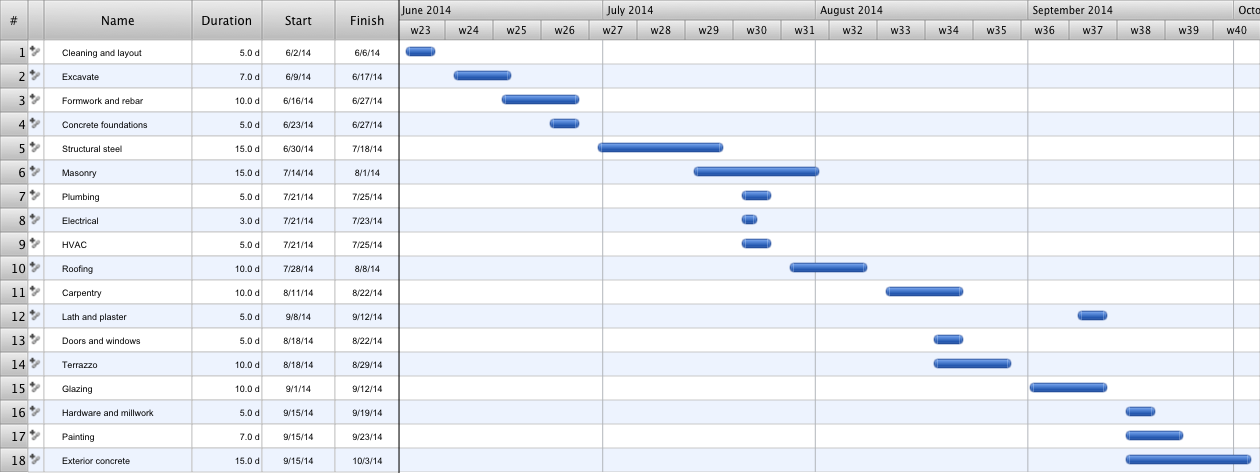
How to Discover Critical Path on a Gantt Chart
ConceptDraw PROJECT is the Gantt chart software that implements critical path method to provide the user with a wide set of project management tools.HelpDesk
How To Create a PERT Chart Using PM Easy Solution
Project Evaluation and Review Technique (PERT) is a method of project tasks evaluation and analysis. PERT - is a method of analyzing the tasks required to complete the project. It includes analysis of the time required to complete each task, as well as the determination of the time required to carry out the whole project. PERT was developed to facilitate the planning of huge and complex projects. PERT is used for very large, complex, and non-standard projects. Technology implies the presence of uncertainty, making it possible to develop a schedule of the project without precise information on details and time required for all of its components. The most popular part of PERT is a method of the critical path, based on the construction of the network schedule (PERT network diagram). ConceptDraw Office delivers you the best way to create PERT chart for your project using compatibility between ConceptDraw PROJECT and ConceptDraw DIAGRAM.CORRECTIVE ACTIONS PLANNING. PERT Chart
The PERT Chart is constructed as part of the process in creating a schedule of corrective actions. The PERT Chart shows the logical connections and consequence of tasks to be performed. It displays the time period for problem solving and the implementation of all activities through the critical path.ConceptDraw Office suite is a software for corrective actions planning.
PERT Chart Software
PERT Chart Software - Activity Network and Project Evaluation and Review Technique, or PERT, charts are a way of documenting and analyzing the tasks in a project.ConceptDraw DIAGRAM is a powerful diagramming and vector drawing software for designing professional looking PERT Charts quick and easy.
Construction Project Chart Examples
ConceptDraw PROJECT provides a set of construction Gantt chart examples. Project manager requires task tracking, and project examples best approach to start. Make your project applying one of our ready-made examples.3 Circle Venn Diagram. Venn Diagram Example
This template shows the Venn Diagram. It was created in ConceptDraw DIAGRAM diagramming and vector drawing software using the ready-to-use objects from the Venn Diagrams Solution from the "Diagrams" area of ConceptDraw Solution Park.Venn Diagrams visualize all possible logical intersections between several sets and are widely used in mathematics, logic, statistics, marketing, sociology, etc.
Activity on Node Network Diagramming Tool
Activity on Node Network Diagramming Tool - Activity Network and Project Evaluation and Review Technique, or PERT, charts are a way of documenting and analyzing the tasks in a project.This sample shows the Activity on node network diagramming method. It was created in ConceptDraw DIAGRAM diagramming and vector drawing software using the Seven Management and Planning Tools solution from the Management area of ConceptDraw Solution Park.
How to Create Gantt Chart
To begin managing a new project, you will need to define the individual Tasks that must be completed to deliver it. The default view for a new project in ConceptDraw PROJECT is the Gantt Chart.How to Create Presentation of Your Project Gantt Chart
During the planning, discussing and execution of a project you may need to prepare a presentation using project views such as the Gantt Chart, Multiproject Dashboard or Resource Usage View. It’s easy do with ConceptDraw PROJECT!- Pert Chart For Building Construction
- Gantt charts for planning and scheduling projects | Pert Chart ...
- How To Create a PERT Chart | How to Create Project Diagrams on ...
- How To Create a PERT Chart | PERT chart - Project management ...
- Gantt charts for planning and scheduling projects | Construction Pert ...
- | Pert Chart Spreadsheet Excel
- Building Project Construction Gantt Chart
- PERT chart - Template | Project Management Critical Path Template
- Project — Working With Costs | Best Example Of Pert Cpm In ...
- How To Create a PERT Chart | Floor Plans | Timeline Diagrams | A ...
- ERD | Entity Relationship Diagrams, ERD Software for Mac and Win
- Flowchart | Basic Flowchart Symbols and Meaning
- Flowchart | Flowchart Design - Symbols, Shapes, Stencils and Icons
- Flowchart | Flow Chart Symbols
- Electrical | Electrical Drawing - Wiring and Circuits Schematics
- Flowchart | Common Flowchart Symbols