"A root cause is an initiating cause of a causal chain which leads to an outcome or effect of interest. Commonly, root cause is used to describe the depth in the causal chain where an intervention could reasonably be implemented to change performance and prevent an undesirable outcome." [Root cause. Wikipedia]
"Problem-solving consists of using generic or ad hoc methods, in an orderly manner, for finding solutions to problems. Some of the problem-solving techniques developed and used in artificial intelligence, computer science, engineering, mathematics, medicine, etc. are related to mental problem-solving techniques studied in psychology." [Problem solving. Wikipedia]
This root cause analysis (RCA) tree diagram example "Personal problem solution" was created using the ConceptDraw PRO diagramming and vector drawing software extended with the Seven Management and Planning Tools solution from the Management area of ConceptDraw Solution Park.
Tree diagram

Personal area (PAN) networks. Computer and Network Examples
 networks")
This example was created in ConceptDraw DIAGRAM using the Computer and Networks Area of ConceptDraw Solution Park and shows the Personal area network.

 Seven Management and Planning Tools
Seven Management and Planning Tools solution extends ConceptDraw DIAGRAM and ConceptDraw MINDMAP with features, templates, samples and libraries of vector stencils for drawing management mind maps and diagrams.
Think and act effectively

 Seven Management and Planning Tools
Seven Management and Planning Tools solution extends ConceptDraw DIAGRAM and ConceptDraw MINDMAP with features, templates, samples and libraries of vector stencils for drawing management mind maps and diagrams.
Activity Network Diagram Method

This sample shows the PERT (Program Evaluation Review Technique) chart of the request on proposal. A request for proposal (RFP) is a request of the company or the organization to potential suppliers to submit the business proposals for service or goods that it is interested to purchase. The RFP is represented on the initial procurement stage and allows to define the risks and benefits.
Fishbone Diagram Problem Solving

To design easily the Fishbone diagram, you can use a special ConceptDraw DIAGRAM vector graphic and diagramming software which contains the powerful tools for Fishbone diagram problem solving offered by Fishbone Diagrams solution for the Management area of ConceptDraw Solution Park.
PDPC

Basic Network Diagram

Applications

7 Management & Planning Tools

Work Order Process Flowchart. Business Process Mapping Examples

The cross-functional flow chart example shows business process mapping of the real property work order.
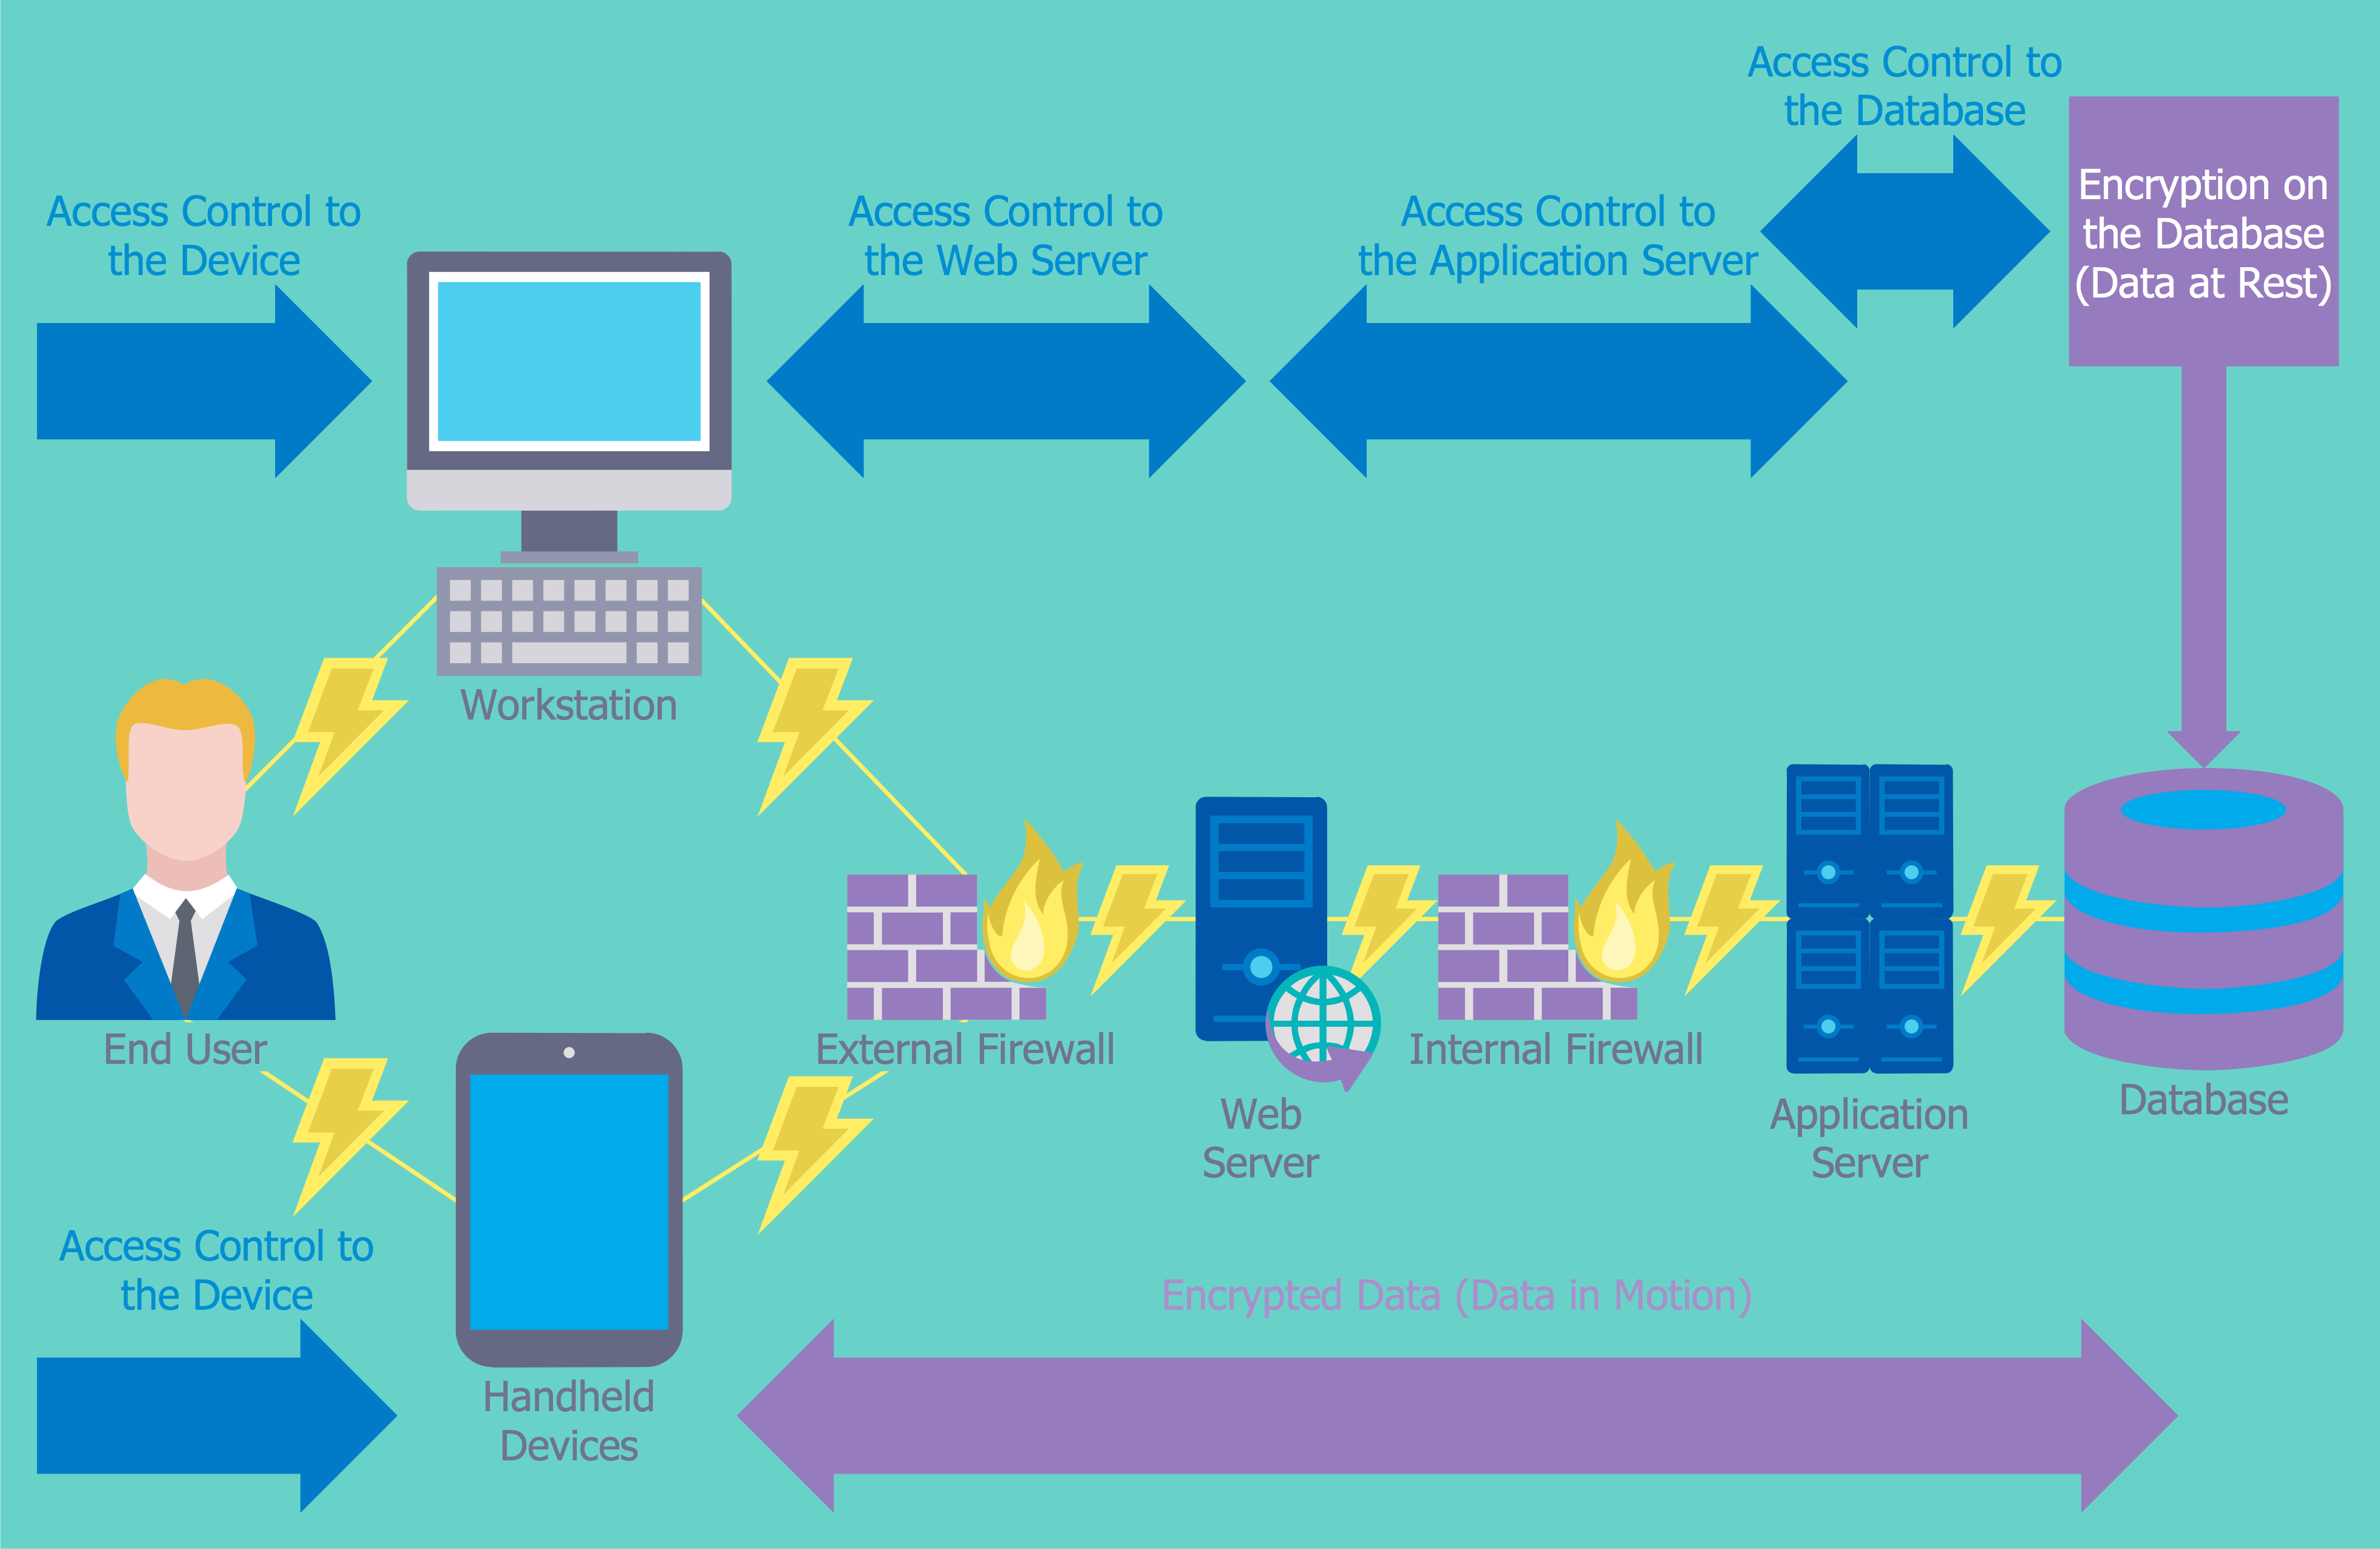
Network Security Devices
Affinity Diagram

Fishbone Diagram Example

Fishbone Diagrams solution included to ConceptDraw Solution Park contains powerful drawing tools and a lot of examples, samples and templates. Each Fishbone diagram example is carefully thought-out by experts and is perfect source of inspiration for you.
- Personal Problem Example
- Root cause analysis tree diagram - Personal problem solution | Root ...
- Root cause analysis tree diagram - Personal problem solution ...
- Root cause analysis tree diagram - Personal problem solution | Fault ...
- Root cause analysis tree diagram - Personal problem solution | How ...
- Concept Mapping | The Best Choice for Creating Diagram ...
- Basic Flowchart Symbols and Meaning | Root cause analysis tree ...
- Fault Tree Analysis Diagrams | Fault Tree Analysis Example | Root ...
- PROBLEM ANALYSIS. Root Cause Analysis Tree Diagram | Root ...
- ConceptDraw Solution Park | Mathematics | Root cause analysis ...
- Using Fishbone Diagrams for Problem Solving | Venn Diagram ...
- Venn Diagram Examples for Problem Solving. Venn Diagram as a ...
- PROBLEM ANALYSIS. Root Cause Analysis Tree Diagram | Cause ...
- Using Fishbone Diagrams for Problem Solving | How to Manage ...
- Root cause analysis tree diagram - Template | PROBLEM ...
- Cause Effect Problem Solution
- Personal Memory Assistant | Evernote exchange - Personal ...
- Using Fishbone Diagrams for Problem Solving | PROBLEM ...
- Personal area (PAN) networks. Computer and Network Examples ...
- Problem Analysis Example
- ERD | Entity Relationship Diagrams, ERD Software for Mac and Win
- Flowchart | Basic Flowchart Symbols and Meaning
- Flowchart | Flowchart Design - Symbols, Shapes, Stencils and Icons
- Flowchart | Flow Chart Symbols
- Electrical | Electrical Drawing - Wiring and Circuits Schematics
- Flowchart | Common Flowchart Symbols
- Flowchart | Common Flowchart Symbols