The vector stencils library "Picture Graphs" contains 35 templates of picture bar graphs for visual data comparison and time series.
Drag a template from the library to your document, set bars number, type category labels, select bars and enter your data.
Use these shapes to draw your pictorial bar charts in the ConceptDraw PRO diagramming and vector drawing software.
The vector stencils library "Picture Graphs" is included in the Picture Graphs solution from the Graphs and Charts area of ConceptDraw Solution Park.
HelpDesk
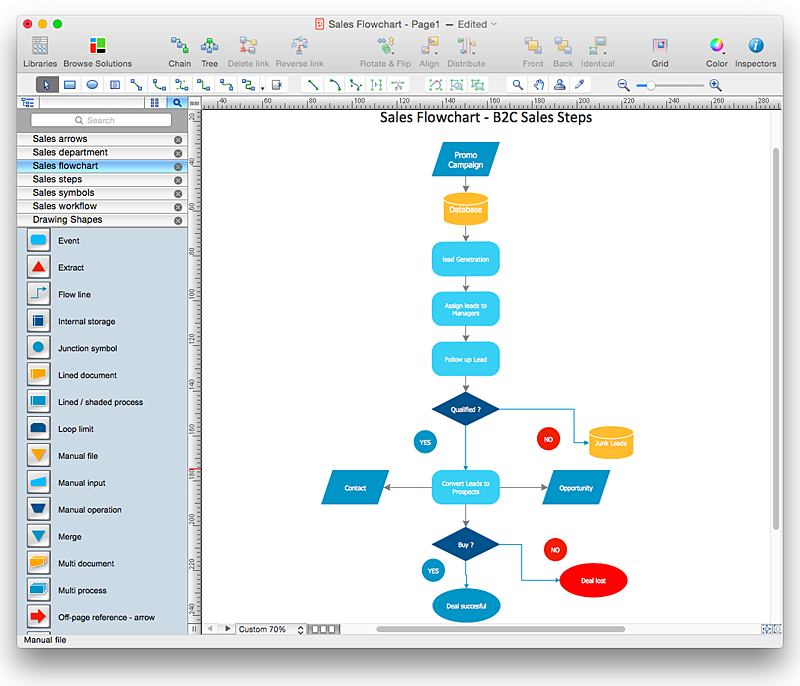
How to Create a Sales Flowchart Using ConceptDraw PRO
A Sales flowchart is a specialized type of flowchart. With the help of a sales flowchart you can visually describe tasks, documents, people responsible for execution at each stage of the sales process. For most commercial organizations, the sales process is inherent to its existence and ability to create profit. Although each company will achieve this aim in its own way, the core selling process remains similar throughout — a potential buyer or prospective customer exchanges money with an organization in return for goods or services. Despite this rather simplistic definition, there exists huge scope as to which approach is taken. Indeed, it is not uncommon for the sales division to be the largest within a corporate structure, employing a team of salespeople, analysts, and the sales managers, who are in charge of sales division operations.The practical applications of sales process flowcharts are numerous and wide ranging. At sales level, you might map the process of customer interactTools to Create Your Own Infographics
Over the past few centuries, data visualization has evolved so much that we use it every day in all areas of our lives. Many believe that infographic is an effective tool of storytelling, as well as analytics, and that it is able to overcome most of the language and educational barriers. Understanding the mechanisms of human perception will help you to understand how abstract forms and colors used in data visualization can transmit information more efficient than long paragraphs of text.- Presentation Clipart | Presentation design elements - Vector clipart ...
- Design elements - Architecture | Arrows - Vector clipart library | Sport ...
- Picture graphs - Vector stencils library
- Cross-Functional Flowchart | Investment and construction ...
- Picture graphs - Vector stencils library | Area Charts | Production of ...
- Arrows - Vector clipart library | Sales arrows - Vector stencils library ...
- People pictograms - Vector stencils library | Basic Flowchart ...
- Circular diagrams - Vector stencils library | Best Vector Drawing ...
- Fire and emergency planning - Vector stencils library | Fire safety ...
- Picture graphs - Vector stencils library | Picture Graphs | Design ...
- Circular arrows diagrams - Vector stencils library | How to Draw the ...
- Vector Person
- Arrows - Vector clipart library
- Comtech - Vector stencils library | Arrows - Vector clipart library ...
- Presentation Clipart | Business People Clipart | Arrows - Vector ...
- Person Vector Png
- Picture graphs - Vector stencils library | Management indicators ...
- Picture graphs - Vector stencils library | Picture graphs - Vector ...
- Presentation Clipart | Presentation design elements - Vector clipart ...
- Design elements - Picture bar graphs | Picture graphs - Vector ...
- ERD | Entity Relationship Diagrams, ERD Software for Mac and Win
- Flowchart | Basic Flowchart Symbols and Meaning
- Flowchart | Flowchart Design - Symbols, Shapes, Stencils and Icons
- Flowchart | Flow Chart Symbols
- Electrical | Electrical Drawing - Wiring and Circuits Schematics
- Flowchart | Common Flowchart Symbols
- Flowchart | Common Flowchart Symbols


