This circular arrows diagram sample shows advanced persistent threat lifecycle.
It was designed on the base of the Wikimedia Commons file: Advanced persistent threat lifecycle.jpg.
[commons.wikimedia.org/ wiki/ File:Advanced_ persistent_ threat_ lifecycle.jpg]
This file is licensed under the Creative Commons Attribution-Share Alike 3.0 Unported license. [creativecommons.org/ licenses/ by-sa/ 3.0/ deed.en]
"Advanced Persistent Threat (APT) APT is a set of stealthy and continuous hacking processes often orchestrated by human targeting a specific entity. APT usually targets organizations and or nations for business or political motives. APT processes require high degree of covertness over a long period of time. As the name implies, APT consists of three major components/ processes: advanced, persistent, and threat. The advanced process signifies sophisticated techniques using malware to exploit vulnerabilities in systems. The persistent process suggests that an external command and control is continuously monitoring and extracting data off a specific target. The threat process indicates human involvement in orchestrating the attack.
APT usually refers to a group, such as a government, with both the capability and the intent to persistently and effectively target a specific entity. The term is commonly used to refer to cyber threats, in particular that of Internet-enabled espionage using a variety of intelligence gathering techniques to access sensitive information, but applies equally to other threats such as that of traditional espionage or attack. Other recognized attack vectors include infected media, supply chain compromise, and social engineering. Individuals, such as an individual hacker, are not usually referred to as an APT as they rarely have the resources to be both advanced and persistent even if they are intent on gaining access to, or attacking, a specific target." [Advanced persistent threat. Wikipedia]
The arrow donut chart example
"Advanced persistent threat lifecycle" was created using the ConceptDraw PRO diagramming and vector drawing software extended with the Circular Arrows Diagrams solution from the area "What is a Diagram" of ConceptDraw Solution Park.
Circular arrows diagram

"There are two definitions for wireless LAN roaming:
Internal Roaming (1): The Mobile Station (MS) moves from one access point (AP) to another AP within a home network because the signal strength is too weak. An authentication server (RADIUS) performs the re-authentication of MS via 802.1x (e.g. with PEAP). The billing of QoS is in the home network. A Mobile Station roaming from one access point to another often interrupts the flow of data among the Mobile Station and an application connected to the network. The Mobile Station, for instance, periodically monitors the presence of alternative access points (ones that will provide a better connection). At some point, based on proprietary mechanisms, the Mobile Station decides to re-associate with an access point having a stronger wireless signal. The Mobile Station, however, may lose a connection with an access point before associating with another access point. In order to provide reliable connections with applications, the Mobile Station must generally include software that provides session persistence.
External Roaming (2): The MS (client) moves into a WLAN of another Wireless Internet Service Provider (WISP) and takes their services (Hotspot). The user can independently of his home network use another foreign network, if this is open for visitors. There must be special authentication and billing systems for mobile services in a foreign network." [Wireless LAN. Wikipedia]
This Cisco roaming wireless local area network diagram example was created using the ConceptDraw PRO diagramming and vector drawing software extended with the Cisco Network Diagrams solution from the Computer and Networks area of ConceptDraw Solution Park.
WLAN diagram

Used Solutions
This bubble diagram sample illustrates employee needs as the base of motivation management.
"Motivation can be defined as "the complex forces, needs, drives, tension states, or other mechanisms within us that will create and maintain voluntary activity directed toward the achievement of personal goals". Employee motivation can be defined as "psychological forces that determine the direction of a person's behavior in an organization, a person's level of effort and a person's level of persistence". It is important to understand that employee motivation is a separate and distinct topic apart from motivation. Vast articles and studies exist on this topic indicating the level of importance employee motivation has in business success. A study conducted by the District Chief of the Tulsa, Oklahoma Fire Department concluded that morale does, in fact, have a direct impact on employee productivity. Employers who understand the theories of motivation have a greater ability to understand what motivates employees, to boost employee morale and thus obtain the advantage of greater organizational productivity. Various studies on motivational techniques have proven the effectiveness of job design, rewards, employee participation, and quality-of-work-life programs on employee motivation." [Employee motivation. Wikipedia]
The bubble diagram example "Employee needs" was created using the ConceptDraw PRO diagramming and vector drawing software extended with the Bubble Diagrams solution from the area "What is a Diagram" of ConceptDraw Solution Park.
Bubble diagram

Circular Arrows

Sales Call

"Chronic care management encompasses the oversight and education activities conducted by health care professionals to help patients with chronic diseases and health conditions such as diabetes, high blood pressure, lupus, multiple sclerosis and sleep apnea learn to understand their condition and live successfully with it. This term is equivalent to disease management (health) for chronic conditions. The work involves motivating patients to persist in necessary therapies and interventions and helping them to achieve an ongoing, reasonable quality of life." [Chronic care management. Wikipedia]
The health care risk diagram (process decision program chart, PDPC) example "Chronic care improvement" was created using the ConceptDraw PRO diagramming and vector drawing software extended with the solution "Seven Management and Planning Tools" from the Management area of ConceptDraw Solution Park.
The health care risk diagram (process decision program chart, PDPC) example "Chronic care improvement" was created using the ConceptDraw PRO diagramming and vector drawing software extended with the solution "Seven Management and Planning Tools" from the Management area of ConceptDraw Solution Park.
Risk diagram
.png--diagram-flowchart-example.png)
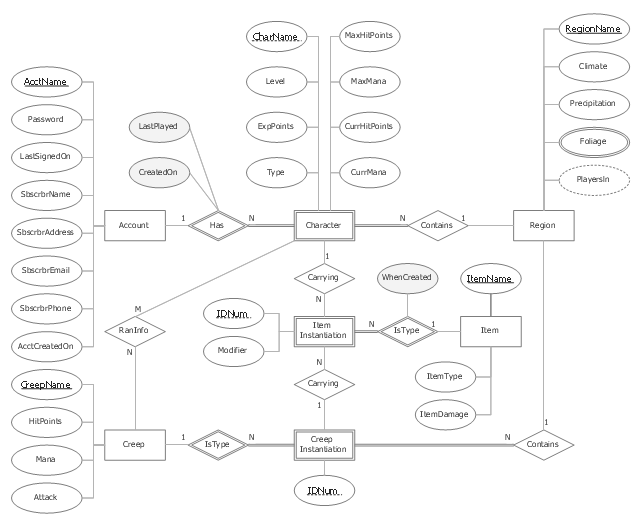
"In software engineering, an entity–relationship model (ER model) is a data model for describing a database in an abstract way.Chen's notation for entity–relationship modeling uses rectangles to represent entity sets, and diamonds to represent relationships appropriate for first-class objects: they can have attributes and relationships of their own. If an entity set participates in a relationship set, they are connected with a line.
Attributes are drawn as ovals and are connected with a line to exactly one entity or relationship set." [Entity–relationship model. Wikipedia]
This sample Chen's ER-diagram illustrates the structure of a typical MMORP game.
"Massively multiplayer online role-playing game (MMORPG) mixes the genres of role-playing video games and Massively multiplayer online games, possibly in the form of web browser-based games, in which a very large number of players interact with one another within a virtual world.
As in all RPGs, players assume the role of a character (often in a fantasy world or science-fiction world) and take control over many of that character's actions. MMORPGs are distinguished from single-player or small multi-player online RPGs by the number of players, and by the game's persistent world (usually hosted by the game's publisher), which continues to exist and evolve while the player is offline and away from the game." [Massively multiplayer online role-playing game. Wikipedia]
This ERD example was redrawn using the ConceptDraw PRO diagramming and vector drawing software from the Wikipedia file: ER Diagram MMORPG.png. [en.wikipedia.org/ wiki/ File:ER_ Diagram_ MMORPG.png]
This file is licensed under the Creative Commons Attribution-Share Alike 3.0 Unported license. [creativecommons.org/ licenses/ by-sa/ 3.0/ deed.en]
This Chen's ERD example is included in the Chen Notation solution from the Software Development area of ConceptDraw Solution Park.
ER-diagram
 Circular Arrows Diagrams
Circular Arrows Diagrams solution extends ConceptDraw PRO v10 with extensive drawing tools, predesigned samples, Circular flow diagram template for quick start, and a library of ready circular arrow vector stencils for drawing Circular Arrow Diagrams, Segmented Cycle Diagrams, and Circular Flow Diagrams. The elements in this solution help managers, analysts, business advisers, marketing experts, scientists, lecturers, and other knowledge workers in their daily work.
- Advanced persistent threat lifecycle | Employee needs | Roaming ...
- Advanced persistent threat lifecycle | Program to Make Flow Chart ...
- Advanced persistent threat lifecycle | Process Flowchart | Basic ...
- Advanced persistent threat lifecycle | Creatively Draw A Diagram ...
- Circular Arrows Diagrams | Systems development life cycle ...
- Local area network (LAN). Computer and Network Examples ...
- Chen's ERD of MMORPG | Process Flowchart | Cross-Functional ...
- Roaming wireless local area network diagram | Wisp Setup Diagram
- Intelligence analyst cycle - Arrow loop diagram | Target and Circular ...
- Internet Connectivity. Computer and Network Examples | Roaming ...
- Roaming wireless local area network diagram | Star Network ...
- Data Flow Diagram | Entity Relationship Diagram Symbols | Pyramid ...
- Program to Make Flow Chart | Innovation life cycle - Arrow loop ...
- Employee needs | Bubble Diagrams | Best Multi-Platform Diagram ...
- Roaming wireless local area network diagram | Wireless Weak Signal
- Roaming wireless local area network diagram | Wireless broadband ...
- Employee needs | Fishbone Diagram Problem Solving | Bubble ...
- Roaming wireless local area network diagram | Cisco Network ...
- Roaming wireless local area network diagram | Telecommunications ...
- Employee needs | Theories Of Quality Of Worklife With Diagram
- ERD | Entity Relationship Diagrams, ERD Software for Mac and Win
- Flowchart | Basic Flowchart Symbols and Meaning
- Flowchart | Flowchart Design - Symbols, Shapes, Stencils and Icons
- Flowchart | Flow Chart Symbols
- Electrical | Electrical Drawing - Wiring and Circuits Schematics
- Flowchart | Common Flowchart Symbols
- Flowchart | Common Flowchart Symbols