Performance Indicators

What is a KPI?

ConceptDraw PRO diagramming and vector drawing software enhanced with Sales Dashboard solution from the Marketing area of ConceptDraw Solution Park allows effectively develop, analyze and improve your business thanks to the excellent possibility of monitoring all KPIs on one screen in a real time.
"A performance indicator or key performance indicator (KPI) is a type of performance measurement. An organization may use KPIs to evaluate its success, or to evaluate the success of a particular activity in which it is engaged. Sometimes success is defined in terms of making progress toward strategic goals, but often success is simply the repeated, periodic achievement of some level of operational goal (e.g. zero defects, 10/ 10 customer satisfaction, etc.). Accordingly, choosing the right KPIs relies upon a good understanding of what is important to the organization. 'What is important' often depends on the department measuring the performance - e.g. the KPIs useful to finance will be quite different from the KPIs assigned to sales. Since there is a need to understand well what is important (to an organization), various techniques to assess the present state of the business, and its key activities, are associated with the selection of performance indicators. These assessments often lead to the identification of potential improvements, so performance indicators are routinely associated with 'performance improvement' initiatives." [Performance indicator. Wikipedia]
The example "Website KPIs - Visual dashboard" was created using the ConceptDraw PRO diagramming and vector drawing software extended with the Composition Dashboard solution from the area "What is a Dashboard" of ConceptDraw Solution Park.
The example "Website KPIs - Visual dashboard" was created using the ConceptDraw PRO diagramming and vector drawing software extended with the Composition Dashboard solution from the area "What is a Dashboard" of ConceptDraw Solution Park.
Visual dashboard

Sales KPI Dashboards

A KPI Dashboard Provides the Answers Your Sales Team

KPI Dashboard

Sales Dashboard Solutions can help your sales team keep an eye on performance

A KPI Dashboard

Sales Performance

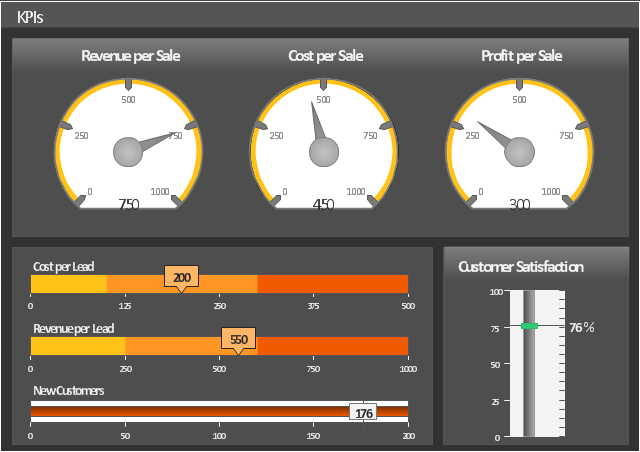
This sales KPIs dashboard sample indicates sale group effectiveness by different parameters, such as Revenue per Sale, Cost per Sale, Profit per Sale, Customer Satisfaction, Cost per Lead and Revenue per Lead using gauge and slider indicators.
The performance dashboard example "Sales KPIs" was created using the ConceptDraw PRO diagramming and vector drawing software extended with the Sales Dashboard solution from the Marketing area of ConceptDraw Solution Park.
The performance dashboard example "Sales KPIs" was created using the ConceptDraw PRO diagramming and vector drawing software extended with the Sales Dashboard solution from the Marketing area of ConceptDraw Solution Park.
Sales dashboard
KPIs and Metrics

Data Visualization Solutions

Sales Dashboard - insight about potential opportunities and key sales operations

Sales Teams are Inherently Competitive
Reporting & Data Visualization

- KPIs and Metrics | Sales metrics and KPIs - Visual dashboard ...
- Performance Indicators | What is a KPI ? | Constant improvement of ...
- Performance Indicators | What is a KPI ? | KPIs and Metrics ...
- Performance Indicators | KPI Dashboard | What is a KPI ? | Key ...
- Kpi Dashboard Examples
- Performance Indicators | What is a KPI ? | KPI Dashboard | Key ...
- Performance Indicators | Constant improvement of key performance ...
- Performance Indicators | What is a KPI ? | Sales Dashboard ...
- Performance Indicators | PM Dashboards | Design elements - Sales ...
- What is a KPI ? | KPI Dashboard | Performance Indicators | Kpi ...
- What is a KPI ? | KPI Dashboard | Performance Indicators | Kpi ...
- Fishbone Diagram For Sales Performance
- KPI Dashboard | Performance Indicators | What is a KPI ? | Kpi ...
- Sales metrics and KPIs - Visual dashboard | Sales KPIs ...
- Sales KPIs - Performance dashboard | Sales geographically ...
- Performance Indicators | Constant improvement of key performance ...
- Enterprise dashboard | Meter Dashboard | Website KPIs - Visual ...
- Constant improvement of key performance indicators | Performance ...
- KPI Dashboard | Basic Flowchart Symbols and Meaning | Human ...
- PM Dashboards | How To Create Project Report | KPI Dashboard ...
- ERD | Entity Relationship Diagrams, ERD Software for Mac and Win
- Flowchart | Basic Flowchart Symbols and Meaning
- Flowchart | Flowchart Design - Symbols, Shapes, Stencils and Icons
- Flowchart | Flow Chart Symbols
- Electrical | Electrical Drawing - Wiring and Circuits Schematics
- Flowchart | Common Flowchart Symbols
- Flowchart | Common Flowchart Symbols