Chart Examples

Chart Templates

Pie Graph Worksheets

 Bar Graphs
The Bar Graphs solution enhances ConceptDraw PRO v10 functionality with templates, numerous professional-looking samples, and a library of vector stencils for drawing different types of Bar Graphs, such as Simple Bar Graph, Double Bar Graph, Divided Bar Graph, Horizontal Bar Graph, Vertical Bar Graph, and Column Bar Chart.
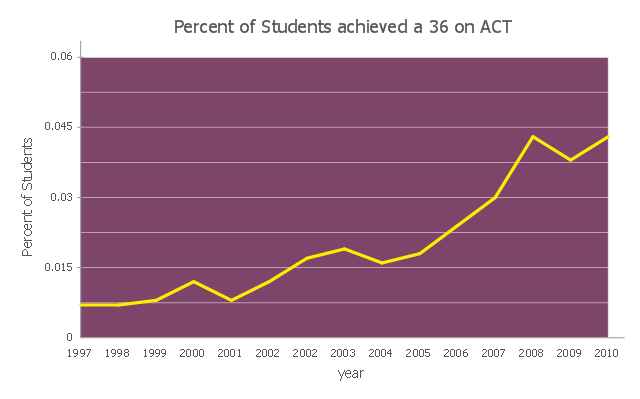
This line graph sample shows the percent of students achieved a 36 on ACT from 1997 to 2011. It was designed on the base of the Wikimedia Commons file: ACT-36-1997 to 2011.png.
[commons.wikimedia.org/ wiki/ File:ACT-36-1997_ to_ 2011.png]
This file is licensed under the Creative Commons Attribution-Share Alike 3.0 Unported license.
[creativecommons.org/ licenses/ by-sa/ 3.0/ deed.en]
"The ACT (... American College Testing) college readiness assessment is a standardized test for high school achievement and college admissions in the United States produced by ACT, Inc. It was first administered in November 1959 by Everett Franklin Lindquist as a competitor to the College Board's Scholastic Aptitude Test, now the SAT Reasoning Test. The ACT originally consisted of four tests: English, Mathematics, Social Studies, and Natural Sciences. In 1989, the Social Studies test was changed into a Reading section (which included a Social Studies subsection) and the Natural Sciences test was renamed the Science Reasoning test, with more emphasis on problem solving skills. In February 2005, an optional Writing test was added to the ACT... In the Spring of 2015, the ACT will start to be offered as a computer-based test that will incorporate some optional Constructed Response Questions; the test content, composite score and multiple choice format will not be affected by these changes. ...
All four-year colleges and universities in the U.S. accept the ACT, but different institutions place different emphases on standardized tests such as the ACT, compared to other factors of evaluation such as class rank, GPA, and extracurricular activities. The main four tests are scored individually on a scale of 1–36, and a Composite score is provided which is the whole number average of the four scores." [ACT (test). Wikipedia]
The line chart example "Percent of students achieved a 36 on ACT" was created using the ConceptDraw PRO diagramming and vector drawing software extended with the Line Graphs solution from the Graphs and Charts area of ConceptDraw Solution Park.
Line chart
Line Chart Examples

Percentage Pie Chart. Pie Chart Examples

This sample shows the Pie Chart of the approximate air composition. You can see the percentage of oxygen, nitrogen and other gases in the air visualized on this Pie Chart.
 Line Graphs
How to draw a Line Graph with ease? The Line Graphs solution extends the capabilities of ConceptDraw PRO v10 with professionally designed templates, samples, and a library of vector stencils for drawing perfect Line Graphs.
Rainfall Bar Chart

This sample was created in ConceptDraw PRO diagramming and vector drawing software using the Bar Graphs Solution from the Graphs and Charts area of ConceptDraw Solution Park.
This line chart sample depicts data from the European Economic Forecast (EUROPEAN ECONOMY 1|2013, Economic and Financial Affairs Winter 2013, European Commission).
[ec.europa.eu/ economy_ finance/ publications/ european_ economy/ 2013/ pdf/ ee1_ en.pdf]
"Exports in France decreased to 36526 EUR Million in October of 2013 from 36637 EUR Million in September of 2013. Exports in France is reported by the Ministère de l'Économie et des Finances. Exports in France averaged 17102.29 EUR Million from 1970 until 2013, reaching an all time high of 37964 EUR Million in August of 2012 and a record low of 1165.60 EUR Million in May of 1970. France is one of the largest exporters of luxury goods and agricultural products in the world. France main exports are: aircrafts (10.1 percent of total exports), food (9.7 percent), chemicals (9.5 percent), industrial machinery (8.3 percent), iron and steel (7.9 percent), electronics (6.7 percent), motor vehicles (6.3 percent) and pharmaceuticals (6.1 percent). Trade outflows to Europe account for 70 percent of total exports. Main export partners are: Germany (16.6 percent of total exports), Italy (8.2 percent), Spain (7.3 percent), Belgium (7.2 percent), the United Kingdom (6.6 percent), the United States (5.6 percent), Netherlands and China. This page contains - France Exports - actual values, historical data, forecast, chart, statistics, economic calendar and news." [tradingeconomics.com/ france/ exports]
The line graph example "France exports of goods and services" was created using ConceptDraw PRO diagramming and vector drawing software extended with Line Graphs solution from Graphs and Charts area of ConceptDraw Solution Park.
Line chart

Line Chart Template for Word

This sample shows the Line Chart of annual percentage change. The Line Chart allows you to clearly see the changes of data over the time.
Pie Donut Chart. Pie Chart Examples

The Pie Donut Chart visualizes the percentage of parts of the whole and looks like as a ring divided into sectors. Pie Donut Charts are widely used in the business, statistics, analytics, mass media.
Donut Chart

Waterfall Bar Chart

 Picture Graphs
Typically, a Picture Graph has very broad usage. They many times used successfully in marketing, management, and manufacturing. The Picture Graphs Solution extends the capabilities of ConceptDraw PRO v10 with templates, samples, and a library of professionally developed vector stencils for designing Picture Graphs.
- Percentage Vs Year Graph
- Competitor Analysis | Types Of Soil Percentage Bar Graph Pictures
- Percentage Pie Chart . Pie Chart Examples | Polar Graph | Business ...
- Chart Examples | Line Graphs | Line Chart Examples | Percent ...
- Bar Chart Examples | Draw A Pie Chart Illustrating The Soil ...
- Economic sector weightings | Iron And Steel Industries Pie Chart
- Graph With Scatter Percentages
- Various Occupation Percentages In The US On A Pie Chart
- Graph Vs Pie Chart Design
- Percentage Pie Chart . Pie Chart Examples | Pie Chart Software ...
- Graph Product Vs Services
- Chart Templates | Scatter Chart Examples | Chart Examples | Plot ...
- Bar Graphs | Divided Bar Diagrams | Percentage Pie Chart . Pie ...
- How to Draw the Different Types of Pie Charts | Percentage Pie ...
- Percentage Pie Chart . Pie Chart Examples
- Percentage Pie Chart . Pie Chart Examples | Atmosphere air ...
- Different Types Of Graph To Represent The Percentage Of Gases ...
- Percentage Pie Chart . Pie Chart Examples | Bar Graphs | Polar ...
- Percentage Bar Graph Illustration
- Percentage Pie Chart . Pie Chart Examples | Bar Graphs | Financial ...
- ERD | Entity Relationship Diagrams, ERD Software for Mac and Win
- Flowchart | Basic Flowchart Symbols and Meaning
- Flowchart | Flowchart Design - Symbols, Shapes, Stencils and Icons
- Flowchart | Flow Chart Symbols
- Electrical | Electrical Drawing - Wiring and Circuits Schematics
- Flowchart | Common Flowchart Symbols
- Flowchart | Common Flowchart Symbols