How to Make an Accounting Process Flowchart

Business Process Flow Diagram

ConceptDraw DIAGRAM extended with Business Process Workflow Diagrams solution from the Business Processes area of ConceptDraw Solution Park is a powerful software which lets easy design Business Process Flow Diagram of any complexity.
Flow Diagram Software

Accounting Flowchart: Purchasing, Receiving, Payable and Payment

"An invoice, bill or tab is a commercial document issued by a seller to a buyer, relating to a sale transaction and indicating the products, quantities, and agreed prices for products or services the seller has provided the buyer.
Payment terms are usually stated on the invoice. These may specify that the buyer has a maximum number of days in which to pay, and is sometimes offered a discount if paid before the due date. The buyer could have already paid for the products or services listed on the invoice.
In the rental industry, an invoice must include a specific reference to the duration of the time being billed, so in addition to quantity, price and discount the invoicing amount is also based on duration. Generally each line of a rental invoice will refer to the actual hours, days, weeks, months, etc., being billed.
From the point of view of a seller, an invoice is a sales invoice. From the point of view of a buyer, an invoice is a purchase invoice. The document indicates the buyer and seller, but the term invoice indicates money is owed or owing. ...
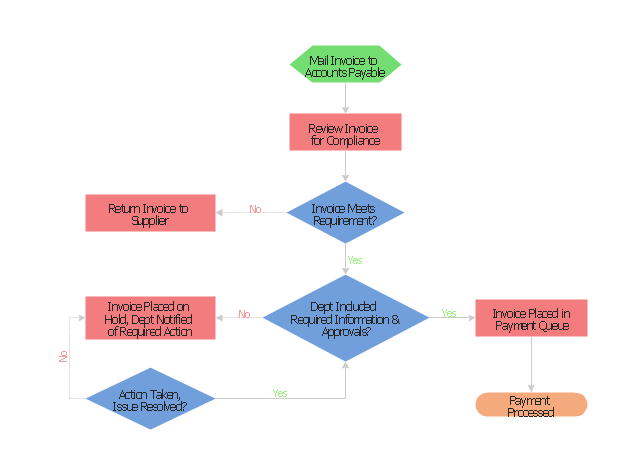
Payment of invoices.
Organizations purchasing goods and services usually have a process in place for approving payment of invoices based on an employee's confirmation that the goods or services have been received.
Typically, when paying an invoice, a remittance advice will be sent to the supplier to inform them their invoice has been paid." [Invoice. Wikipedia]
The flow chart example "Invoice payment process" was created using the ConceptDraw PRO diagramming and vector drawing software extended with the Flowcharts solution from the area "What is a Diagram" of ConceptDraw Solution Park.
Payment terms are usually stated on the invoice. These may specify that the buyer has a maximum number of days in which to pay, and is sometimes offered a discount if paid before the due date. The buyer could have already paid for the products or services listed on the invoice.
In the rental industry, an invoice must include a specific reference to the duration of the time being billed, so in addition to quantity, price and discount the invoicing amount is also based on duration. Generally each line of a rental invoice will refer to the actual hours, days, weeks, months, etc., being billed.
From the point of view of a seller, an invoice is a sales invoice. From the point of view of a buyer, an invoice is a purchase invoice. The document indicates the buyer and seller, but the term invoice indicates money is owed or owing. ...
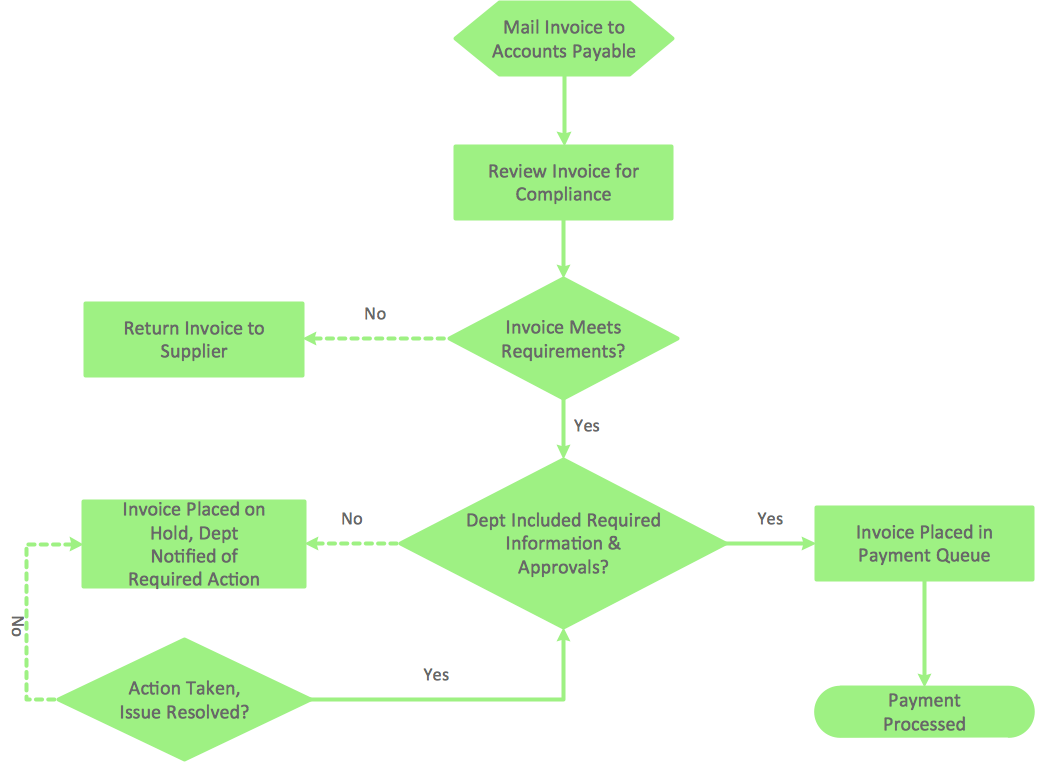
Payment of invoices.
Organizations purchasing goods and services usually have a process in place for approving payment of invoices based on an employee's confirmation that the goods or services have been received.
Typically, when paying an invoice, a remittance advice will be sent to the supplier to inform them their invoice has been paid." [Invoice. Wikipedia]
The flow chart example "Invoice payment process" was created using the ConceptDraw PRO diagramming and vector drawing software extended with the Flowcharts solution from the area "What is a Diagram" of ConceptDraw Solution Park.
Flowchart - Invoice payment process
The Data flow diagram (DFD) example "Payment for goods using UPS code scanner" shows data flow in process of payment for goods in the shop using the MaxiCode scanner.
"MaxiCode is a public domain, machine-readable symbol system originally created and used by United Parcel Service. Suitable for tracking and managing the shipment of packages, it resembles a barcode, but uses dots arranged in a hexagonal grid instead of bars. MaxiCode has been standardised under ISO/ IEC 16023.
A MaxiCode symbol (internally called "Bird's Eye", "Target", "dense code", or "UPS code") appears as a 1 inch square, with a bullseye in the middle, surrounded by a pattern of hexagonal dots. It can store about 93 characters of information, and up to 8 MaxiCode symbols can be chained together to convey more data. The centered symmetrical bullseye is useful in automatic symbol location regardless of orientation, and it allows MaxiCode symbols to be scanned even on a package traveling rapidly." [MaxiCode. Wikipedia]
This example of data flow diagram (Gane & Sarson notation) was created using the ConceptDraw PRO diagramming and vector drawing software extended with the Data Flow Diagrams solution from the Software Development area of ConceptDraw Solution Park.
DFD
---payment-for-goods-using-ups-code-scanner.png--diagram-flowchart-example.png)
Flowchart Program Mac
Flow Chart Symbols

Easy Flowchart Software

Accounting Flowchart Purchasing Receiving Payable and Payment

- Invoice payment process - Flowchart | Accounting Flowchart ...
- Invoice payment process - Flowchart | Flow Diagram Software | Flow ...
- Invoice payment process - Flowchart | Flowchart For Payment ...
- Accounts Payable Flowchart | Accounting Flowchart: Purchasing ...
- Online Payment Process Flow Chart
- Buy To Pay Process Diagram
- E Payment Flow Chart
- Flow chart Example. Warehouse Flowchart | Invoice payment ...
- Data Flow Diagram Process | Why Flowchart Important to ...
- Payment Flow Diagram For Website
- ERD | Entity Relationship Diagrams, ERD Software for Mac and Win
- Flowchart | Basic Flowchart Symbols and Meaning
- Flowchart | Flowchart Design - Symbols, Shapes, Stencils and Icons
- Flowchart | Flow Chart Symbols
- Electrical | Electrical Drawing - Wiring and Circuits Schematics
- Flowchart | Common Flowchart Symbols
- Flowchart | Common Flowchart Symbols