Basic Flowchart Symbols and Meaning
Flowchart Symbols and Meaning - Provides a visual representation of basic flowchart symbols and their proposed use in professional workflow diagram, standard process flow diagram and communicating the structure of a well-developed web site, as well as their correlation in developing on-line instructional projects. See flowchart's symbols by specifics of process flow diagram symbols and workflow diagram symbols.
How to Create Presentation of Your Project Gantt Chart
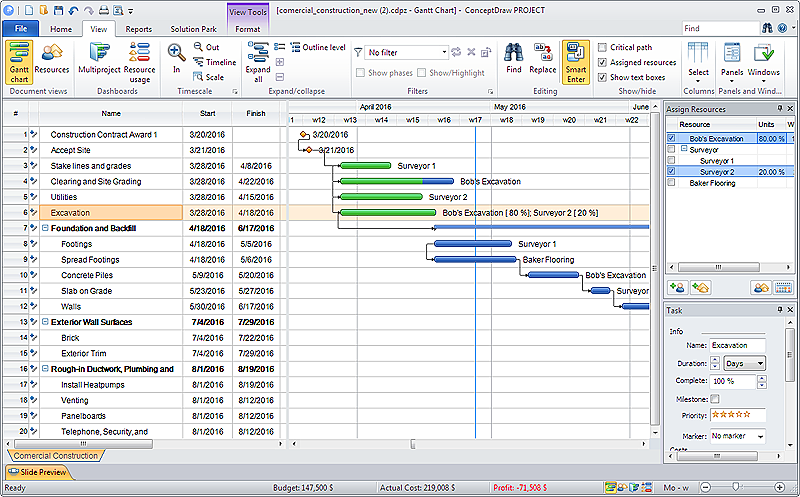
During the planning, discussing and execution of a project you may need to prepare a presentation using project views such as the Gantt Chart, Multiproject Dashboard or Resource Usage View. It’s easy do with ConceptDraw PROJECT!How to Construct a Fishbone Diagram
Fishbone, Ishikawa or Cause and Effect diagram helps understand the reasons of completed or potential actions by structuring their causes in smaller categories. Also, one can use it to see how the contributing factors are related to each other. In everyday company routine, a Cause and Effect diagram is helpful with a number of regular activities like brainstorming, project management, and problem solving.How to Construct a Fishbone Diagram? Construction a Fishbone diagram in professional diagramming software ConceptDraw PRO is more easy than you think. Just use the predesigned vector elements from the Fishbone Diagrams library for Fishbone Diagrams solution or one of plenty Fishbone templates and examples, and you will get a Cause and Effect diagram in minutes.
HelpDesk
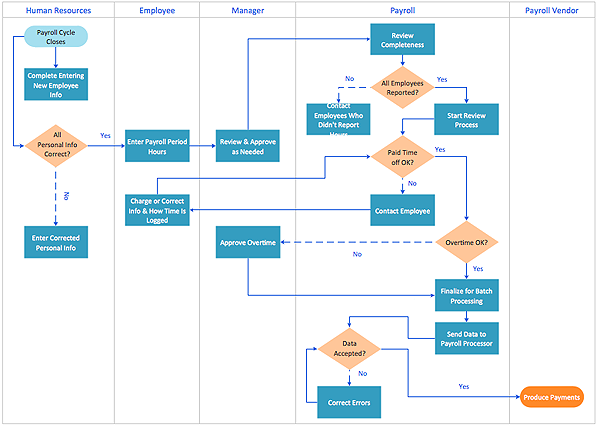
How to Use a Cross - Functional Flowcharts Solution
Cross-functional process is a process that involves multiple divisions, each of which makes its part of the entire company workflow. For example: product development, lead management , client orders processing – and other critical processes. Using a Cross-Functional flowchart is a clear way of showing each team member’s responsibilities and how processes get shared or transferred between different teams and departments.The Cross-Functional flowchart is a clear way to visualize the document flow in your organization. The ability to create Cross-functional diagrams is provided by the Cross-Functional Flowcharts solution.
HelpDesk
How to Draw a Pictorial Chart in ConceptDraw PRO
Pictorial Infographics is used to visually present data comparison. Pictorial charts use relative sizes or repetitions of the same icon, picture, or symbol to show data relation. Using a Pictorial chart to show business data patterns and trends will add much more efficiency to your business communications. Finding the right tool for the job can sometimes be tricky. Developing sophisticated and effective infographics can require toolsthat may span many different products. Fortunately, ConceptDraw PRO has everything you need to create polished Pictorial Infographics that beautifully and accurately represent your story, no matter how complex it may be.HelpDesk
How to Create a Release Burn-Down Chart Using ConceptDraw PRO
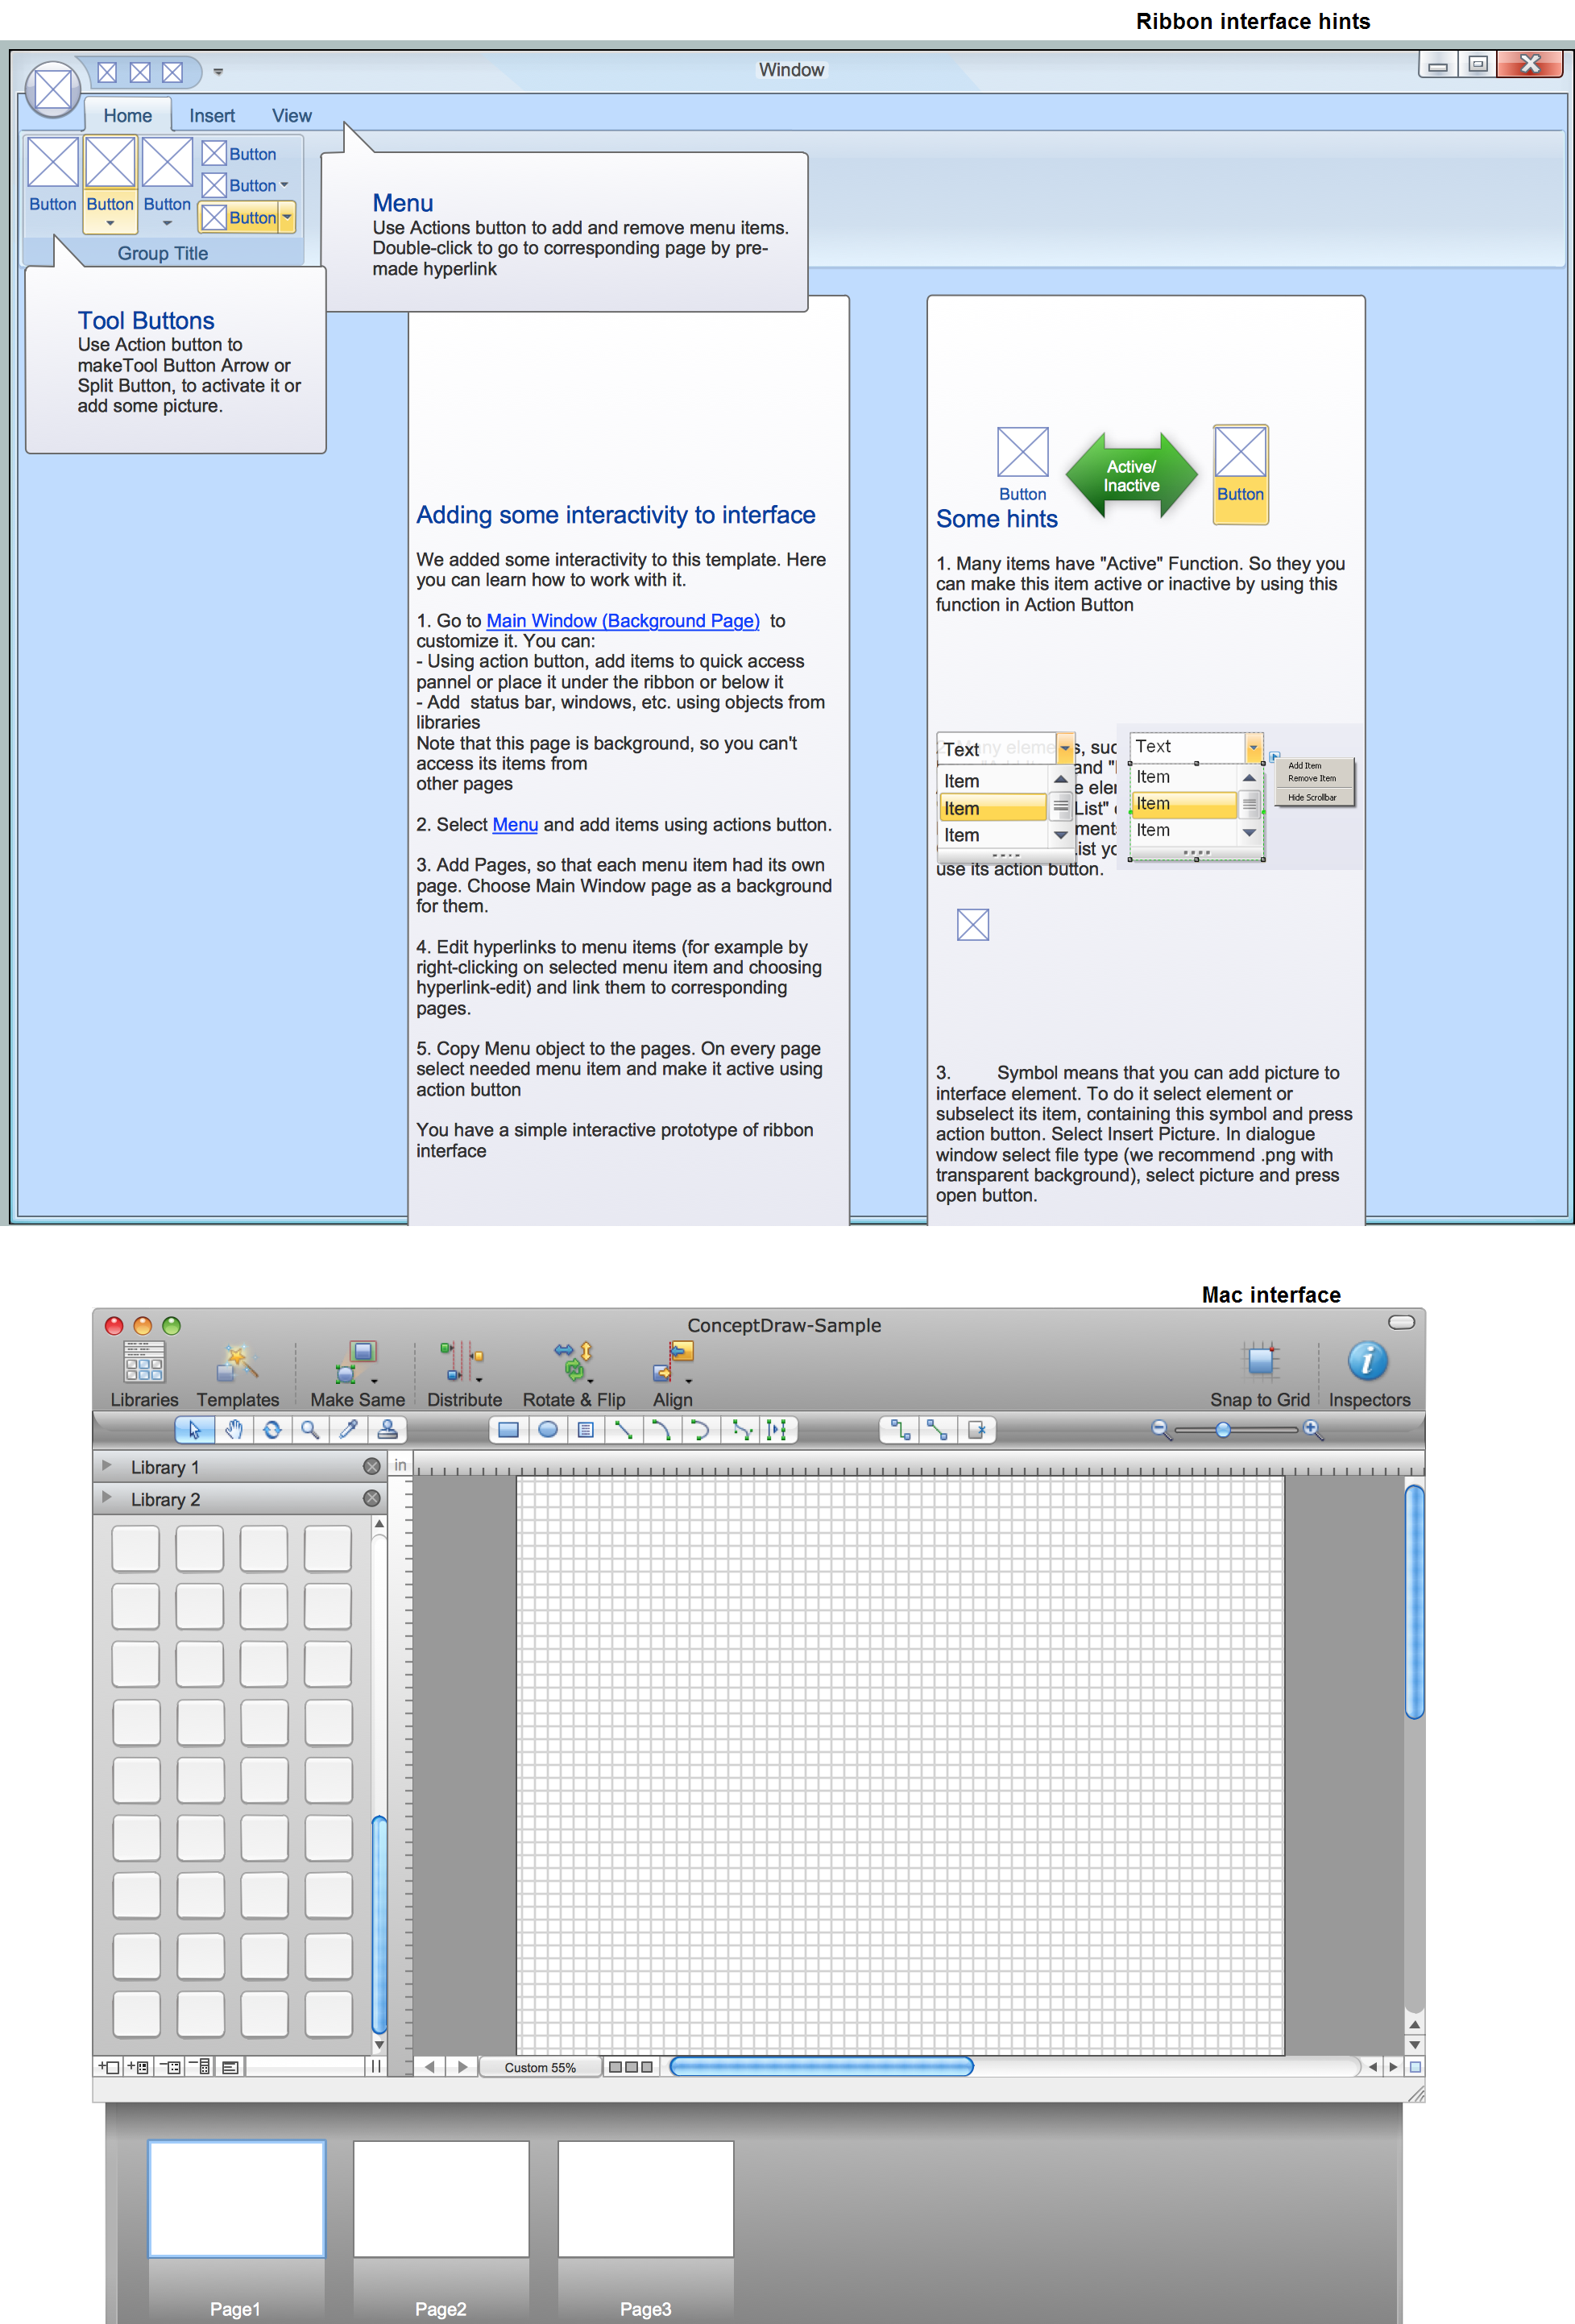
The Agile methodology provides project teams the ability to quickly adapt the project to the current situation and thus achieve maximum productivity. According the Scrum method the steps needed to fulfill the project goal breaks down by using short sprints or iterations. The iterations together with an extensive collaboration can increase productivity by better understanding the entire flow of a project. A release burn-down chart is used to track a progress on a Scrum project. The ConceptDraw Scrum Workflow Solution makes it easy for Agile project team to build any professional Scrum diagram such as a Release velocity chart, Release burn-down chart, Sprint burn-down chart, or a Team velocity chart.GUI Prototyping with ConceptDraw PRO
All about prototyping. GUI Prototyping with ConceptDraw. Download prototyping software.Create Organizational Chart
CSOdessa team is happy to provide cost effective Organizational Chart Software for companies of any size. It is a ConceptDraw PRO extended with Organizational Charts Solution from the Management Area.ConceptDraw PRO organizational chart professional software allows quickly create organizational charts, flow charts, time lines, and much more. Use it for drawing organizational chart for any size company and analyzing organizational structure. Use ConceptDraw to create organizational chart, visualize company Organizational chart, hospital Organizational chart, hotel Organizational chart, corporate organizational chart, etc.
HelpDesk
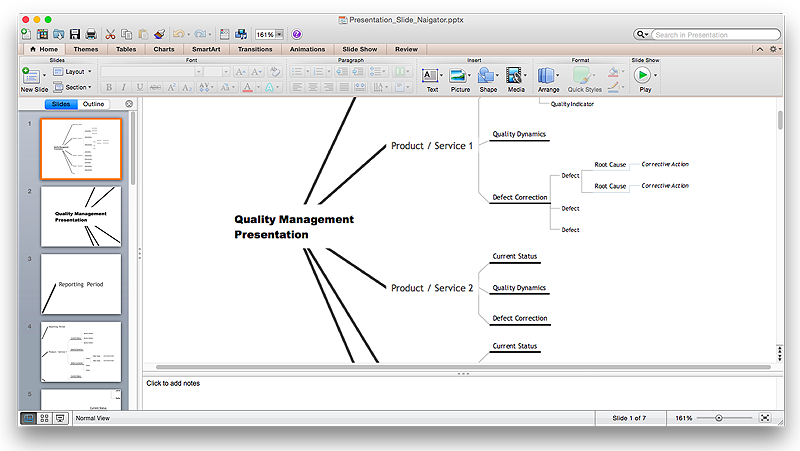
How to Create a PowerPoint® Presentation from a Mind Map
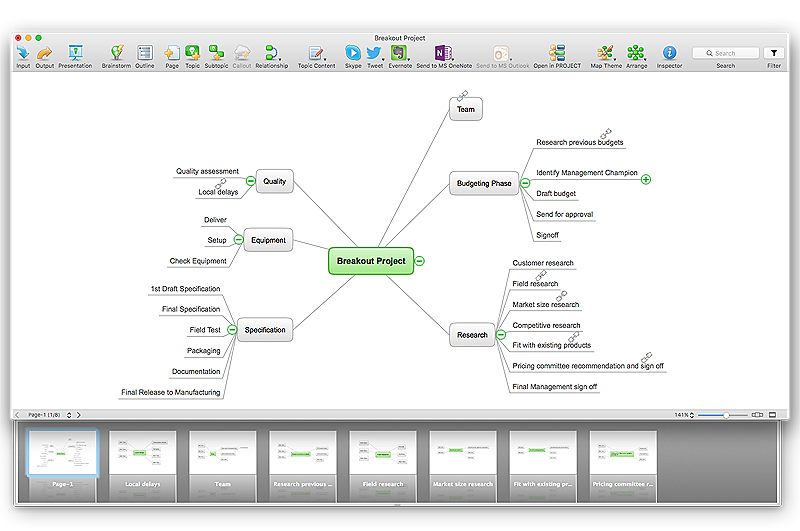
ConceptDraw MINDMAP allows you to create a traditional PowerPoint Presentation from your mind mind maps. There are two different variants when exporting to PowerPoint - one places editable text into the template of your choice, the other places the pieces of the map that you want to show into the slides.HelpDesk
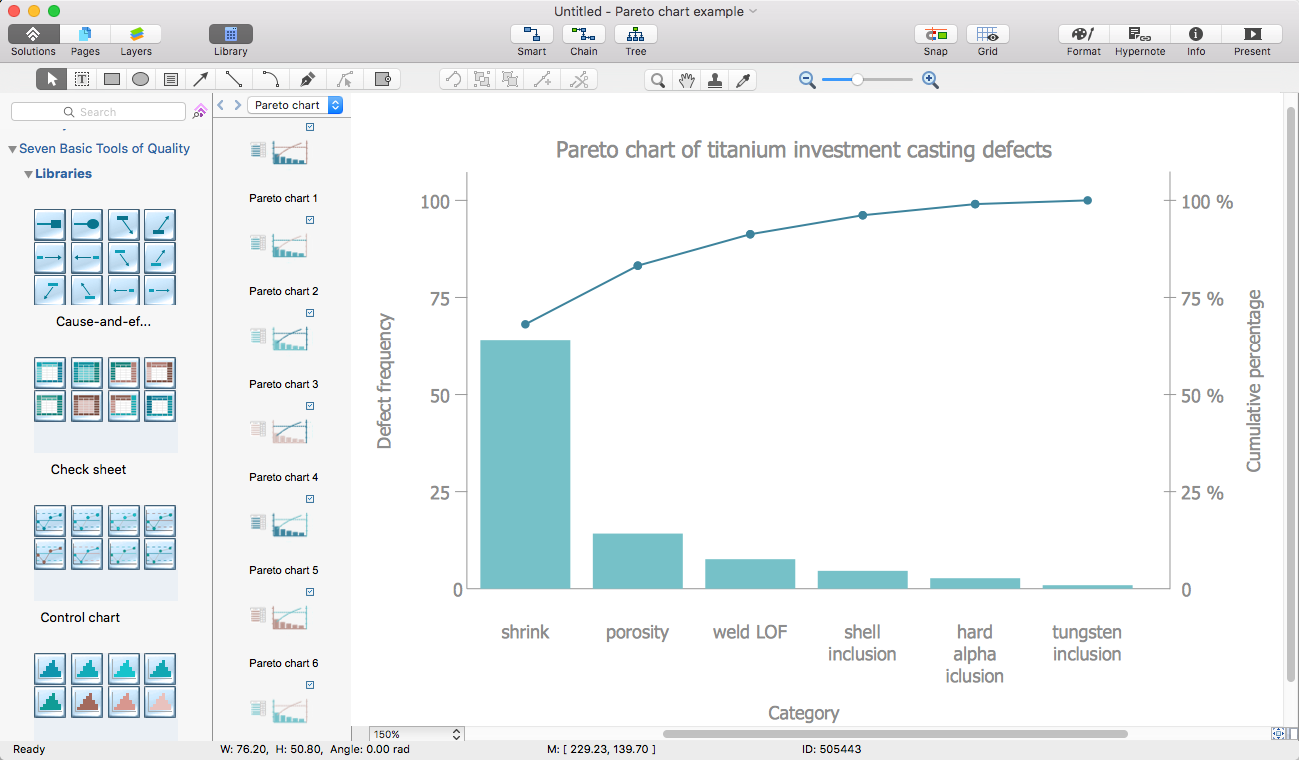
How to Draw a Pareto Chart
The Seven Basic Tools of Quality were picked as effective visual tool-set for identifying the root cause of quality-related problems within the workplace. Seven Basic Tools of Quality comprise of seven diagram that are diverse enough to be used to any business troubleshooting scenario, but simple enough that employees of all types can understand and apply them. One of these tools is a Pareto chart. It combines both a line graph and a bar chart, where the bar chart displays data values, and a line represents a total value. Pareto chart is used for quality control to identify the source of the quality problem.ConceptDraw Seven Basic Tools of Quality solution delivers a big set of vector stencil libraries and samples for each quality control diagram, including a Pareto chart.
How to Build Cloud Computing Diagram Principal Cloud Manufacturing
The term “cloud” is very popular and widely used now, it is a server, data processing centre, or a network which lets to store the data and software, provides access to them, allows to run applications without installation and gives the possibility to process data hosted remotely via the Internet connection.For documenting the Cloud Computing Architecture with a goal to facilitate the communication between stakeholders are successfully used the Cloud Computing Architecture diagrams. It is convenient and easy to draw various Cloud Computing Architecture diagrams in ConceptDraw PRO software with help of tools of the Cloud Computing Diagrams Solution from the Computer and Networks Area of ConceptDraw Solution Park.
HelpDesk
How to Import Text to ConceptDraw MINDMAP
Mind mapping is a quick and efficient way to start up project. When you create a mind map, it might be necessary to use a previously recorded files, notes, or text outlines. The importing capabilities of ConceptDraw MINDMAP allows you to easily convert text into a mind map. You can quickly turn your TXT file to the hierarchical structure of mind map. You can convert the entire TXT file as well as a selected part. ConceptDraw MINDMAP supports the ability to convert text in both single-page and multi-page mind map.You can create a multiple page project mind map quickly, using various text work-pieces. Read this article to find out how to create your multi page mind map from a text outline.HelpDesk
How to Plan and Allocate Resources in Your Project with ConceptDraw PROJECT for Windows
Effective resource management is a key factor in the successful project implementation. The common types of resources for which the project manager has an impact, include material resources (materials, energy), staff (work) and equipment. CoceptDraw PROJECT provides easy ways to project Resources Management: Create a list of project resources and assign the right human resource, as well as the necessary material, or equipment to be used.HelpDesk
How to Download ConceptDraw Products Through a Proxy Server
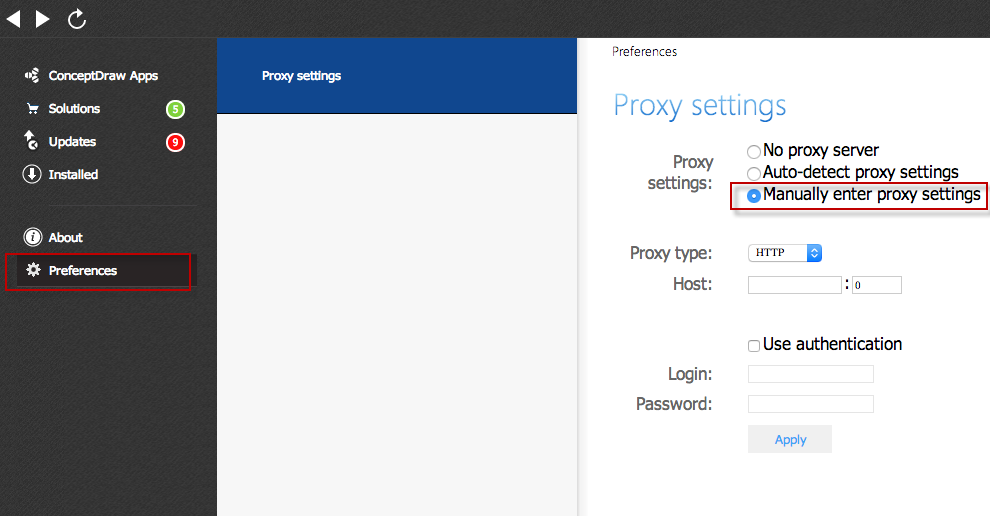
If you are on a corporate network, there’s a good chance you connect to the Internet using a proxy server. Thankfully, ConceptDraw automatically detects your proxy settings and works just fine through HTTP(S) proxy servers.How To use House Electrical Plan Software
House Electrical Plan Software for creating great-looking home floor, electrical plan using professional electrical symbols.You can use many of built-in templates, electrical symbols and electical schemes examples of our House Electrical Diagram Software.
ConceptDraw is a fast way to draw: Electrical circuit diagrams, Schematics, Electrical Wiring, Circuit schematics, Digital circuits, Wiring in buildings, Electrical equipment, House electrical plans, Home cinema, Satellite television, Cable television, Closed-circuit television.
House Electrical Plan Software works across any platform, meaning you never have to worry about compatibility again. ConceptDraw PRO allows you to make electrical circuit diagrams on PC or macOS operating systems.

- Panel Data Flow Chart
- Basic Flowchart Symbols and Meaning | Flow Chart Symbols ...
- Data Flow Diagram Symbols. DFD Library | ERD Symbols and ...
- Data Flow Diagram Symbols. DFD Library | Anyone Have an ERD ...
- Basic Flowchart Symbols and Meaning | Flow Chart Symbols ...
- Telecommunication Network Diagrams | Design elements ...
- Electrical Drawing Software and Electrical Symbols | Data Flow ...
- Basic Flowchart Symbols and Meaning | Flowchart Symbols ...
- Flow chart Example. Warehouse Flowchart | Data Flow Diagrams ...
- Example of DFD for Online Store ( Data Flow Diagram ) DFD ...
- Accounting Flowchart Symbols | Account Flowchart Stockbridge ...
- Process Flow Diagram Symbols | Process Flowchart | Design ...
- Flow chart Example. Warehouse Flowchart | Building Drawing ...
- Gym and Spa Area Plans | Data Flow Diagrams (DFD) | Reflected ...
- Providing telecom services - Cross-functional flowchart | Cross ...
- Basic Flowchart Symbols and Meaning | Process Flowchart ...
- Sales Process Map | Example of DFD for Online Store ( Data Flow ...
- Process Flowchart | Example of DFD for Online Store ( Data Flow ...
- Telecommunication Network Diagrams | Telecom equipment ...
- Multi Layer Venn Diagram . Venn Diagram Example | Process ...
- ERD | Entity Relationship Diagrams, ERD Software for Mac and Win
- Flowchart | Basic Flowchart Symbols and Meaning
- Flowchart | Flowchart Design - Symbols, Shapes, Stencils and Icons
- Flowchart | Flow Chart Symbols
- Electrical | Electrical Drawing - Wiring and Circuits Schematics
- Flowchart | Common Flowchart Symbols
- Flowchart | Common Flowchart Symbols


