Percentage Pie Chart. Pie Chart Examples

This sample shows the Pie Chart of the approximate air composition. You can see the percentage of oxygen, nitrogen and other gases in the air visualized on this Pie Chart.
This pie chart sample shows the atmosphere air composition. It was designed on the base of the Wikimedia Commons file: Air composition pie chart.JPG.
[commons.wikimedia.org/ wiki/ File:Air_ composition_ pie_ chart.JPG]
This file is licensed under the Creative Commons Attribution-Share Alike 3.0 Unported license. [creativecommons.org/ licenses/ by-sa/ 3.0/ deed.en]
"The atmosphere of Earth is a layer of gases surrounding the planet Earth that is retained by Earth's gravity. The atmosphere protects life on Earth by absorbing ultraviolet solar radiation, warming the surface through heat retention (greenhouse effect), and reducing temperature extremes between day and night (the diurnal temperature variation).
The common name given to the atmospheric gases used in breathing and photosynthesis is air. By volume, dry air contains 78.09% nitrogen, 20.95% oxygen, 0.93% argon, 0.039% carbon dioxide, and small amounts of other gases. Air also contains a variable amount of water vapor, on average around 1%. Although air content and atmospheric pressure vary at different layers, air suitable for the survival of terrestrial plants and terrestrial animals currently is only known to be found in Earth's troposphere and artificial atmospheres." [Atmosphere of Earth. Wikipedia]
The pie chart example "Atmosphere air composition" was created using the ConceptDraw PRO diagramming and vector drawing software extended with the Pie Charts solution of the Graphs and Charts area in ConceptDraw Solution Park.
Pie chart

Donut Chart

Pie Chart Examples and Templates

Pie chart examples and templates created using ConceptDraw DIAGRAM software helps you get closer with pie charts and find pie chart examples suite your needs.
Organizational Chart Templates

Use the Organizational Charts Solution for ConceptDraw DIAGRAM to create your own Organizational Charts of any complexity quick, easy and effective.
The Organizational Charts designed with ConceptDraw DIAGRAM are vector graphic documents and are available for reviewing, modifying, converting to a variety of formats (image, HTML, PDF file, MS PowerPoint Presentation, Adobe Flash or MS Visio XML), printing and send via e-mail in one moment.

Business Report Pie. Pie Chart Examples

Swim Lane Diagrams

Polar Graph

Blank Scatter Plot
 Biology
Biology solution extends ConceptDraw DIAGRAM software with samples, templates and libraries containing biological vector symbols, to help you create scientific and educational designs in the field of biology.
Biology Illustration
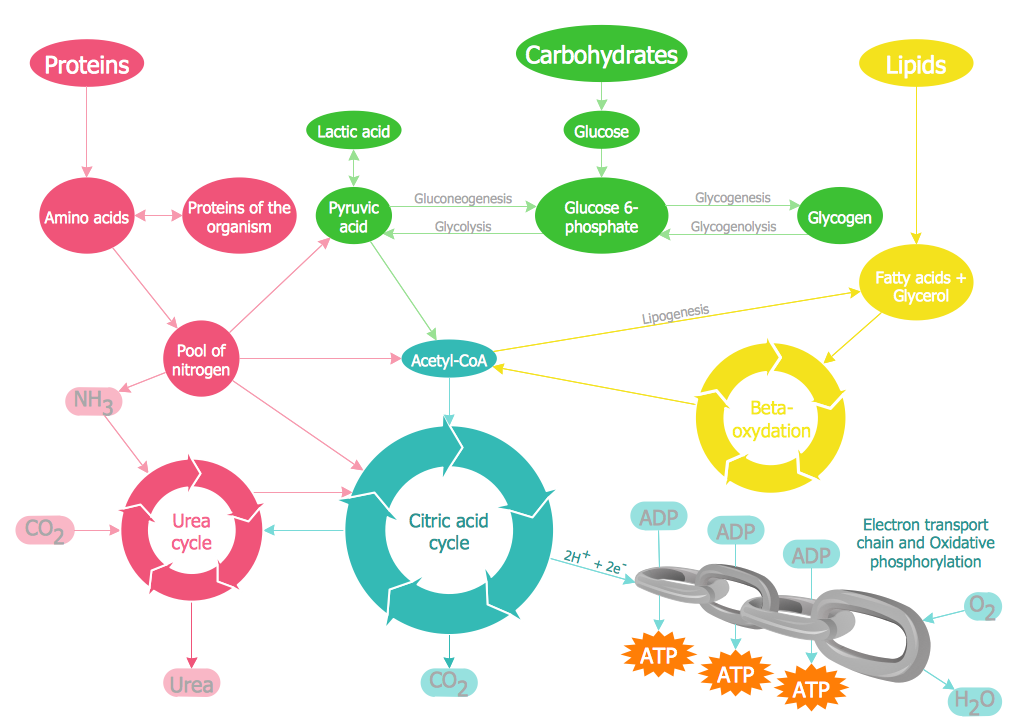
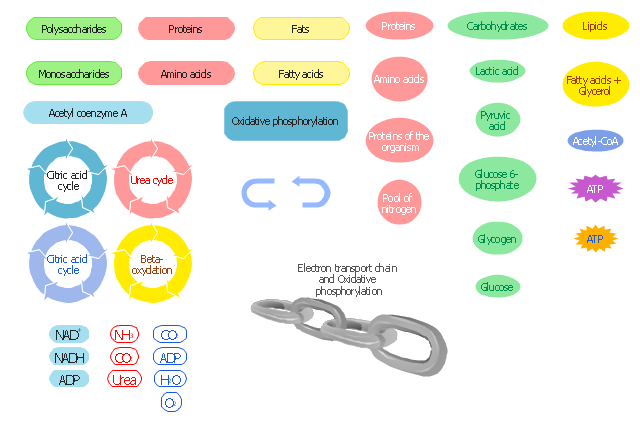
The vector stencils library " Biochemistry of metabolism" contains 46 metabolite symbols for drawing metabolic pathways maps, biochemical diagrams and metabolism process flow charts using the ConceptDraw PRO diagramming and vector drawing software.
"Metabolites are the intermediates and products of metabolism. The term metabolite is usually restricted to small molecules. Metabolites have various functions, including fuel, structure, signaling, stimulatory and inhibitory effects on enzymes, catalytic activity of their own (usually as a cofactor to an enzyme), defense, and interactions with other organisms (e.g. pigments, odorants, and pheromones). A primary metabolite is directly involved in normal "growth", development, and reproduction. Alcohol is an example of a primary metabolite produced in large-scale by industrial microbiology. A secondary metabolite is not directly involved in those processes, but usually has an important ecological function. Examples include antibiotics and pigments such as resins and terpenes etc. ...
The metabolome forms a large network of metabolic reactions, where outputs from one enzymatic chemical reaction are inputs to other chemical reactions." [Metabolite. Wikipedia]
The shapes example "Design elements - Biochemistry of metabolism" is included in the Biology solution from the Science and Education area of ConceptDraw Solution Park.
Metabolic pathway symbols
Biology Drawing Software

- Percentage Pie Chart . Pie Chart Examples | Percentage Of Oxygen ...
- Atmosphere air composition | Pie Chart Nitrogen Oxygen ...
- Construct A Pie Chart To Show The Composition Of Nitrogen ...
- Atmosphere air composition | Percentage Pie Chart . Pie Chart ...
- Draw Pie Chart Showing Gases In Air Nitrogen Oxygen Carbon
- Pie Chart Of Oxygen
- How Many Percent Of Oxygen In The Air Show In Pie Chart
- Oxygen Circle Percentage Chart
- Atmosphere air composition | Percentage Pie Chart . Pie Chart ...
- Bar Diagrams for Problem Solving. Create space science bar charts ...
- Graph Showing Levels Of Oxygen In Parks Throughout The Day
- Approximate composition of the air - Pie chart | Percentage Pie ...
- Percentage Pie Chart . Pie Chart Examples | Approximate ...
- Atmosphere air composition | Pie Charts | Percentage Pie Chart . Pie ...
- Approximate composition of the air - Pie chart | Percentage Pie ...
- Donut Chart Templates | Percentage Pie Chart . Pie Chart Examples ...
- Bar Diagrams for Problem Solving. Create space science bar charts ...
- Atmosphere air composition | Design elements - Composition charts ...
- Percentage Pie Chart . Pie Chart Examples | Sales Growth. Bar ...
- Atmosphere air composition | Pie Chart Examples and Templates ...
- ERD | Entity Relationship Diagrams, ERD Software for Mac and Win
- Flowchart | Basic Flowchart Symbols and Meaning
- Flowchart | Flowchart Design - Symbols, Shapes, Stencils and Icons
- Flowchart | Flow Chart Symbols
- Electrical | Electrical Drawing - Wiring and Circuits Schematics
- Flowchart | Common Flowchart Symbols
- Flowchart | Common Flowchart Symbols