"At the base of the identity of an organisational is its organizational culture. A culture is comprised of the shared values, customs, traditions, rituals, behaviours and beliefs shared by a social group (national, ethnic, organizational, etc.). Cultures also share languages, or ways of speaking. From a communication perspective, cultures are made and remade through the words we use to describe our world. Culture represents a common set of values (“shared meanings”), shared by members of a population, a organization, a project/ programme purpose unit or a profession (e.g., engineers versus scientists). Culture change with the times but the speed at which the culture of different institutions change varies widely." [Development Cooperation Handbook/ The development aid organization/ Organizational Culture. Wikibooks]
This organizational culture triangle diagram example derived from Parker and Benson's model. It's for explaination of the Regatta: Adoption Method.
The pyramid diagram example "Organizational culture" was redesigned using the ConceptDraw PRO diagramming and vector drawing software from Wikimedia Commons file Organization_ Triangle.png. [commons.wikimedia.org/ wiki/ File:Organization_ Triangle.png]
This file is licensed under the Creative Commons Attribution-Share Alike 2.5 Generic license. [creativecommons.org/ licenses/ by-sa/ 2.5/ deed.en]
The triangular chart sample "Organizational culture" is included in the Pyramid Diagrams solution from the Marketing area of ConceptDraw Solution Park.
Pyramid diagram

ConceptDraw Arrows10 Technology

You don't know how should diagramming software work?
Is it possible to develop a diagram as quickly as the ideas come to you?
Yes. The innovative ConceptDraw Arrows10 Technology - This is more than enough versatility to draw any type of diagram with any degree of complexity.
You can start draw your diagram manually now.
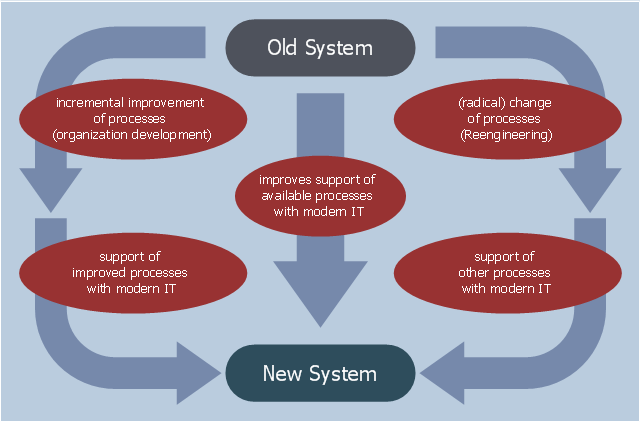
This example was designed on the base of the diagram "Organization Development vs. Business Process Reengineering" from the website of the Computer Science, Faculty 3, Bremen University. [informatik.uni-bremen.de/ gdpa/ part3/ p3gpo.htm]
"The efforts, behaviour, and performance of an employee in any organization for their growth is known as Organization development(OD).
Organization development (OD) is a field of research, theory and practice dedicated to expanding the knowledge and effectiveness of people to accomplish more successful organizational change and performance. ...
Key concepts of OD theory include: organizational climate (the mood or unique “personality” of an organization, which includes attitudes and beliefs that influence members’ collective behavior), organizational culture (the deeply-seated norms, values and behaviors that members share) and organizational strategies (how an organization identifies problems, plans action, negotiates change and evaluates progress)." [Organization development. Wikipedia]
The workflow diagram example "Organization Development vs. Business Process Reengineering" was created using ConceptDraw PRO software extended with the Business Process Workflow Diagrams solution from the Business Processes area of ConceptDraw Solution Park.
Workflow diagram
HelpDesk
How to Change the Working Time in a Project

"Business process improvement (BPI) is a systematic approach to help an organization optimize its underlying processes to achieve more efficient results. ...
An organization is only as good as its processes. To be able to make the necessary changes in an organization, one needs to understand the key processes of the company. Rummler and Brache suggested a model for running a Process Improvement and Management project (PI&M), containing the following steps:
1. Identify the process to be improved (based on a critical business issue): The identification of key processes can be a formal or informal exercise. The management team might select processes by applying a set of criteria derived from strategic and tactical priorities, or process selection is based on obvious performance gaps. It is important is to select the process(es) which have the greatest impact on a competitive advantage or customer requirement.
2. Develop the objective(s) for the project based on the requirements of the process: The focus might be on quality improvement, productivity, cost, customer service or cycle time. The goal is however always the same; to get the key process under control.
3. Select the members of the cross-functional team: A horizontal (cross-functional) analysis is carried out by a team composed of representatives of all functions involved in the process. While a consultant or in-house staff person can do the job, the quality of the analysis and the commitment to change is far greater with a cross-functional team.
4. Document the current process by creating a flowchart or "organization map": Describe the process regarding the Organizational level, the Process level and the Job/ Performer level according to Rummler. Develop a cross-functional process map for the process.
5. Identify "disconnects" in the process: “Disconnections” are everything that inhibit the efficiency and effectiveness of the process. The identification should be categorized into the three levels: The Organizational level, the Process level and the Job/ Performer level.
6. Recommend changes (organizational, in the process or in its execution): Categorize and prioritize the main problems and possibilities, evaluate alternative solutions. Develop a cross-functional process map for the recommended process.
7. Establish process and sub-process measures: The process measures should reflect the objectives of the project.
8. Implement the improvements." [Business process improvement. Wikipedia]
The opportunity flow chart example "Replacing engine oil" was created using the ConceptDraw PRO diagramming and vector drawing software extended with the Cross-Functional Flowcharts solution from the Business Processes area of ConceptDraw Solution Park.
Opportunity flowchart

- Organization Change
- 4m Change Flow Chart
- Organization Change With Diagram
- Organization Development vs. Business Process Reengineering ...
- Change Management Software
- How to Draw an Organization Chart | Organizational Structure ...
- Pyramid Diagram | UML Diagram Types List | Organizational culture ...
- Why We Need An Organizational Structure Change
- 4m Change Management Procedure
- How To Draw Flowchart To Change Car Engine Oil
- Swot Analysis For Change Management
- How to Draw an Organization Chart | Examples of Flowcharts, Org ...
- Organizational Structure | Matrix Organization Structure | How to ...
- Information Technology Architecture | How to Draw an Organization ...
- Donut Chart Templates | Blank Calendar Template | How to Change ...
- Organization Development vs. Business Process Reengineering ...
- Matrix Organization Structure | Organizational Structure | How to ...
- Organizational culture - Triangle diagram | Pyramid Diagram | How ...
- How to Draw an Organization Chart | Process Flowchart | Types of ...
- Interactive Venn Diagram | Example of Organizational Chart | How to ...
- ERD | Entity Relationship Diagrams, ERD Software for Mac and Win
- Flowchart | Basic Flowchart Symbols and Meaning
- Flowchart | Flowchart Design - Symbols, Shapes, Stencils and Icons
- Flowchart | Flow Chart Symbols
- Electrical | Electrical Drawing - Wiring and Circuits Schematics
- Flowchart | Common Flowchart Symbols
- Flowchart | Common Flowchart Symbols