HelpDesk
How to Draw a Pyramid Diagram in ConceptDraw PRO
Pyramid diagram (triangle diagram) is used to represent data, which have hierarchy and basics. Due to the triangular form of diagram, each pyramid section has a different width. The width of the segment shows the level of its hierarchy. Typically, the top of the pyramid is the data that are more important than the base data. Pyramid scheme can be used to show proportional and hierarchical relationships between some logically related items, such as departments within an organization, or successive elements of any process. This type of diagram is often used in marketing to display hierarchical related data, but it can be used in a variety of situations. ConceptDraw PRO allows you to make a pyramid diagram, quickly and easily using special libraries.How to Create a Pyramid Diagram
ConceptDraw Pyramid Diagram software allows drawing column charts using predesigned objects or drawing tools. In ConceptDraw Pyramid Diagram software you can find a complete set of column chart tools and objects.HelpDesk
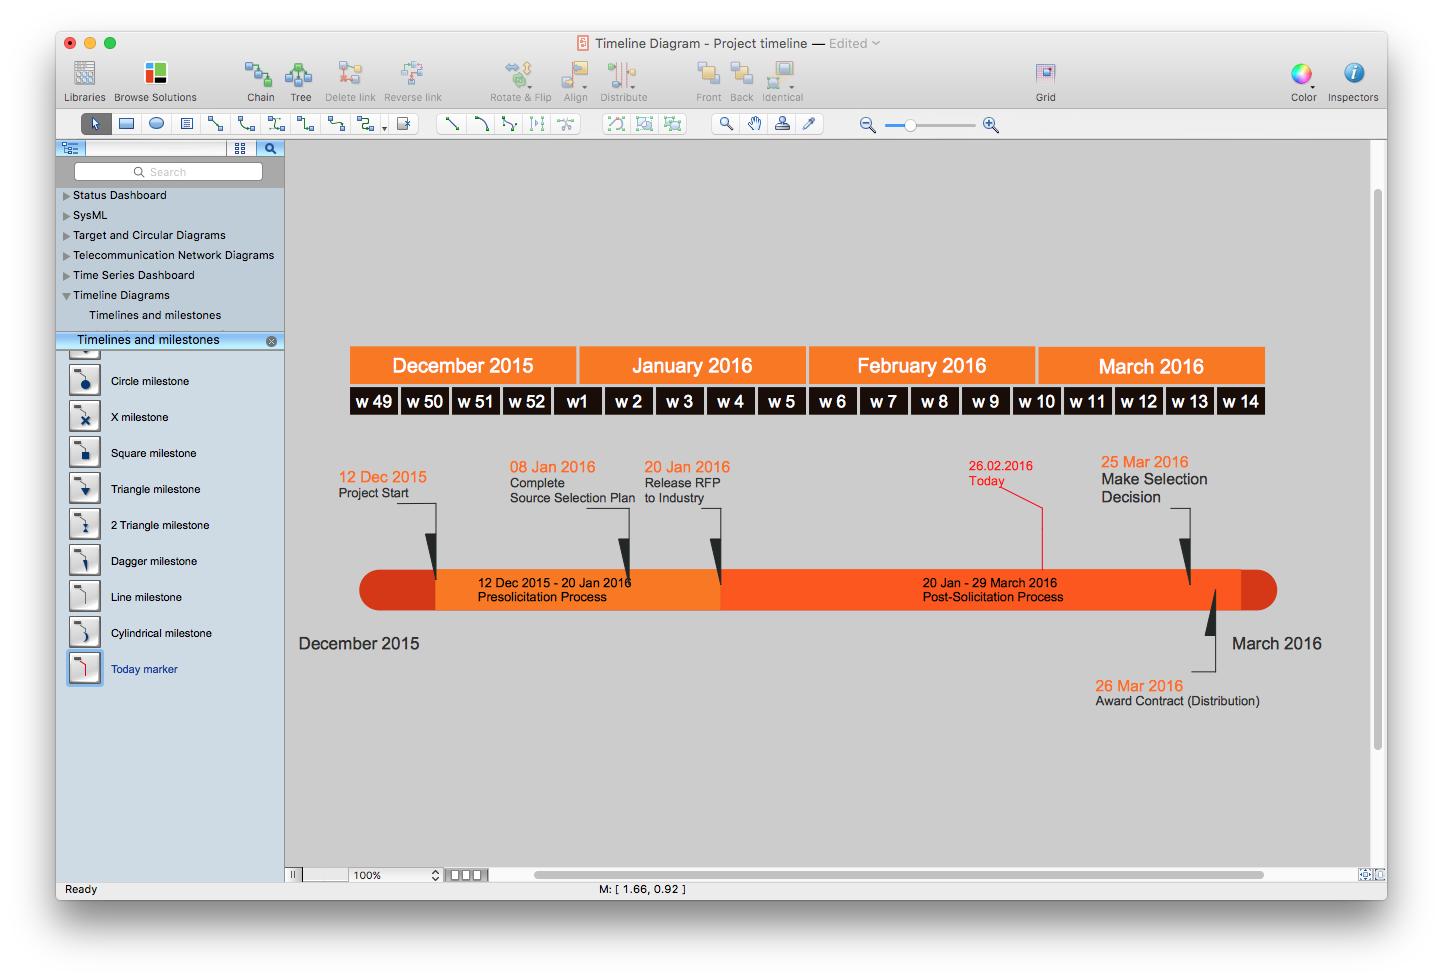
How to Create a Timeline Diagram in ConceptDraw PRO
A Timeline is a chart which displays a project plan schedule in chronological order. A Timeline is used in project management to depict project milestones and visualize project phases, and show project progress. The graphic form of a timeline makes it easy to understand critical project milestones, such as the progress of a project schedule. Timelines are particularly useful for project scheduling or project management when accompanied with a Gantt chart. It captures the main of what the project will accomplish and how it will be done. making a project timeline is one of the most important skills a project manager needs have. Making comprehensive, accurate timelines allows you getting every project off in the best way. ConceptDraw PRO allows you to draw a timeline charts using special library.How to Create a Pie Chart
Create a Pie Chart with ConceptDraw software quickly and easily. The simple tutorial helps you learn how to create a pie chart.
 Astronomy
Astronomy solution extends ConceptDraw PRO software with illustration and sketching software with templates, samples and libraries of a variety of astronomy symbols, including constellations, galaxies, stars, and planet vector shapes; a whole host of cele
How to Create a Column Chart
The question how to create a column chart have a simple answer. Use ConceptDraw tips to find out how to create a column chart depicts your data the best way.- 5 level pyramid model diagram of information systems types ...
- Pyramid Diagram
- 3 level pyramid model diagram of information systems types | 5 level ...
- Production Process Flow Chart
- Pyramid Diagram
- Pyramid Diagram | Process Flowchart | Types of Flowchart ...
- Bar Diagrams for Problem Solving. Create business management ...
- Process Flowchart | Marketing and Sales Organization chart ...
- Marketing and Sales Organization chart. Organization chart Example
- Flow Diagram Software | Pyramid Diagram | Pyramid Diagram ...
- Business diagrams & Org Charts with ConceptDraw PRO | Bar ...
- Pyramid Diagram and Pyramid Chart | Flow Diagram Software ...
- How to Draw an Organization Chart | Pie Chart Examples and ...
- Social Media Response Management Charts - software tools ...
- Probability Quality Control Tools
- Pyramid Diagram | Pyramid Diagram | 5 level pyramid model ...
- Flowchart Marketing Process. Flowchart Examples | Flow Diagram ...
- Flowchart Example: Flow Chart of Marketing Analysis | How to Draw ...
- Business diagrams & Org Charts with ConceptDraw PRO | Types of ...
- How to Draw an Organization Chart | Pyramid Diagram | Business ...
- ERD | Entity Relationship Diagrams, ERD Software for Mac and Win
- Flowchart | Basic Flowchart Symbols and Meaning
- Flowchart | Flowchart Design - Symbols, Shapes, Stencils and Icons
- Flowchart | Flow Chart Symbols
- Electrical | Electrical Drawing - Wiring and Circuits Schematics
- Flowchart | Common Flowchart Symbols
- Flowchart | Common Flowchart Symbols


