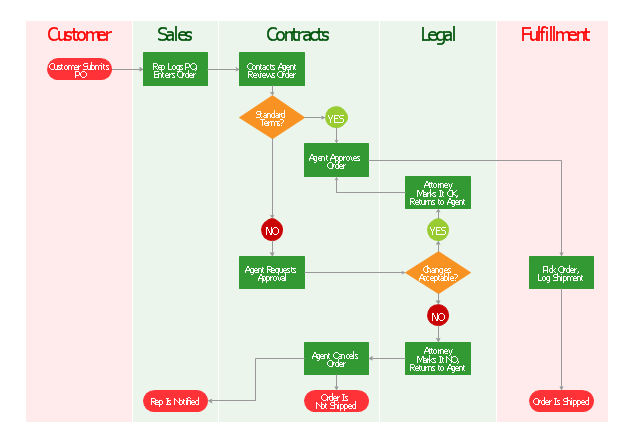
"Order processing is a key element of Order fulfillment. Order processing operations or facilities are commonly called "distribution centers". "Order processing" is the term generally used to describe the process or the work flow associated with the picking, packing and delivery of the packed item(s) to a shipping carrier. The specific "order fulfillment process" or the operational procedures of distribution centers are determined by many factors. Each distribution center has its own unique requirements or priorities." [Order processing. Wikipedia]
The vertical cross-functional flow chart example "Order processing" was created using the ConceptDraw PRO diagramming and vector drawing software extended with the Flowcharts solution from the area "What is a Diagram" of ConceptDraw Solution Park.
The vertical cross-functional flow chart example "Order processing" was created using the ConceptDraw PRO diagramming and vector drawing software extended with the Flowcharts solution from the area "What is a Diagram" of ConceptDraw Solution Park.
Cross-functional flowchart
 Flowcharts
The Flowcharts solution for ConceptDraw DIAGRAM is a comprehensive set of examples and samples in several varied color themes for professionals that need to represent graphically a process. Solution value is added by the basic flow chart template and shapes' libraries of flowchart notation. ConceptDraw DIAGRAM flow chart creator lets one depict the processes of any complexity and length, as well as design the Flowchart either vertically or horizontally.
Modelling Complex Events with Event-Driven Process chain

ConceptDraw DIAGRAM - software that reduces the time needed to create a business process model.
Work Order Process Flowchart. Business Process Mapping Examples

The cross-functional flow chart example shows business process mapping of the real property work order.
Check Order Process Flowchart. Flowchart Examples

This sample shows the Flowchart of the printing the elements of the binary search tree. They are printed in the order from lowest to greatest. On this diagram you can see the rectangles that represent the steps and decision points that are represented as diamonds with questions. It is necessary to make the decision that will determine the next step.
Accounting Flowchart Purchasing Receiving Payable and Payment

 Event-driven Process Chain Diagrams
Event-Driven Process Chain Diagrams solution extends ConceptDraw DIAGRAM functionality with event driven process chain templates, samples of EPC engineering and modeling the business processes, and a vector shape library for drawing the EPC diagrams and EPC flowcharts of any complexity. It is one of EPC IT solutions that assist the marketing experts, business specialists, engineers, educators and researchers in resources planning and improving the business processes using the EPC flowchart or EPC diagram. Use the EPC solutions tools to construct the chain of events and functions, to illustrate the structure of a business process control flow, to describe people and tasks for execution the business processes, to identify the inefficient businesses processes and measures required to make them efficient.
Purchasing Flowchart - Purchase Order. Flowchart Examples

The flow chart example shows the steps of purchasing business process.
This UML sequence diagram of order processing center (OPC) was created on the base of sequence diagram from the software architecture documentation wiki of the Software Engineering Institute (SEI) of Carnegie Mellon University (CMU).
[wiki.sei.cmu.edu/ sad/ index.php/ Image:OPCRuntimeRefinementView_ PP2.png]
"Order processing is the process or work-flow associated with the picking, packing and delivery of the packed items to a shipping carrier. Order processing is a key element of order fulfillment. Order processing operations or facilities are commonly called "distribution centers"." [Order processing. Wikipedia]
This order processing center UML sequence diagram example was created using the ConceptDraw PRO diagramming and vector drawing software extended with the ATM UML Diagrams solution from the Software Development area of ConceptDraw Solution Park.
Order processing center UML sequence diagram

Cross-Functional Flowchart (Swim Lanes)
 *")
Use flowchart maker of ConceptDraw DIAGRAM enhanced with solutions from ConceptDraw Solution Park to create diagrams to present and explain structures, process flows, logical relationships, networks, design schemes and other visually organized information and knowledge.
Account Flowchart Stockbridge System. Flowchart Examples

This is a flowchart of a data processing system combining manual and computerized processing to handle accounts receivable, billing, and general ledger.
 Cross-Functional Flowcharts
Cross-functional flowcharts are powerful and useful tool for visualizing and analyzing complex business processes which requires involvement of multiple people, teams or even departments. They let clearly represent a sequence of the process steps, the order of operations, relationships between processes and responsible functional units (such as departments or positions).
EPC for Business Process Improvement

ConceptDraw DIAGRAM for making EPC diagrams provides business improvement. The Event-driven Process Chain ( EPC ) Diagrams allows reach improvement throughout an organisation.
Flowchart Symbols Accounting. Activity-based costing (ABC) flowchart
 flowchart *")
DFD Library — Design elements

Types of Flowchart - Overview


Easy Flowchart Software

HelpDesk
How to Create a Cross-Functional Flowchart

Computer Hardware - Reseller Business Plan

Purchasing Flow Chart. Purchasing Flowchart Example

- Order processing - Cross-functional flowchart | Order processing ...
- Order Processing Process Flow Chart
- Order processing center - UML sequence diagram | Order ...
- Flowchart Sales Order Processing
- Order processing - EPC flow chart | Flowchart Of Order System
- Accounting Information Systems Flowchart Symbols | Order ...
- Order Processing Flow Chart
- Frequency Distribution Dashboard | Logistics Flow Charts | Order ...
- Flowchart Marketing Process. Flowchart Examples | Work Order ...
- Order processing - Cross-functional flowchart | Cross-Functional ...
- Cross-functional flowchart
- Flow process chart | LLNL Flow Charts | Order processing - EPC ...
- Purchase order processing UML activity diagram | Order processing ...
- Process flowchart - Order processing | Taxi order process - BPMN ...
- Order processing center - UML sequence diagram | Order process ...
- EPC Diagrams Illustrate Business Process Work Flows | Event ...
- Work Order Process Flowchart . Business Process Mapping ...
- Order processing center - UML sequence diagram | UML sequence ...
- Business Process Draw Order Fulfillment Process
- Work Order Process Flowchart . Business Process Mapping Examples
- ERD | Entity Relationship Diagrams, ERD Software for Mac and Win
- Flowchart | Basic Flowchart Symbols and Meaning
- Flowchart | Flowchart Design - Symbols, Shapes, Stencils and Icons
- Flowchart | Flow Chart Symbols
- Electrical | Electrical Drawing - Wiring and Circuits Schematics
- Flowchart | Common Flowchart Symbols
- Flowchart | Common Flowchart Symbols