SWOT Analysis

Basic Flowchart Examples

This SWOT matrix diagram example was created on the base of article "An Easy Way To Jumpstart Your Strategic Plan: SWOT" by Leslie Wolf from the website of the California Digital Library, the University of California. "Strategic planning doesn’t have to be a daunting and lengthy process. The goal is really a simple one: to help you understand your world and build a road map to guide your efforts. ...
This analysis tool can help you focus your attention on the specific success factors that are right for your team.
The tool is called a SWOT analysis. SWOT stands for Strengths and Weaknesses, Opportunities and Threats. Here’s what it means:
(1) Strengths are those positive internal attributes that strengthen your business or team. You can develop plans to capitalize on those strengths.
(2) Weaknesses are those negative internal attributes that are working against your success. You can shore up those weaknesses so they don’t stop your success.
(3) Opportunities are those external conditions that can have a positive effect on your goals. These opportunities can point you in the right direction.
(4) Threats are those external conditions that can have a negative effect on your goals. These threats will affect you less if you can identify and minimize them. ...
We thought it would be helpful to show you a sample SWOT analysis for a business you can easily visualize: a small independent bookstore in a university town. The store owner brought the team together to think about how the bookstore could survive during the continuing financial downturn. After an hour of brainstorming, this is the SWOT analysis they developed." [cdlib.org/ cdlinfo/ 2010/ 09/ 29/ an-easy-way-to-jumpstart-your-strategic-plan-swot/ ]
The matrix diagram example "SWOT analysis for a small independent bookstore" was created using the ConceptDraw PRO diagramming and vector drawing software extended with the SWOT Analysis solution from the Management area of ConceptDraw Solution Park.
SWOT matrix

Cross Functional Flowchart for Business Process Mapping

Use a variety of drawing tools, smart connectors and shape libraries to create flowcharts of complex processes, procedures and information exchange. Define and document basic work and data flows, financial, production and quality management processes to increase efficiency of you business.
Swot Analysis Examples for Mac OSX

"Prioritization Matrix ... tool is used to prioritize items and describe them in terms of weighted criteria. It uses a combination of tree and matrix diagramming techniques to do a pair-wise evaluation of items and to narrow down options to the most desired or most effective. Popular applications for the Prioritization Matrix include Return-on-Investment (ROI) or Cost-Benefit analysis (Investment vs. Return), Time management Matrix (Urgency vs. Importance), etc." [Seven Management and Planning Tools. Wikipedia]
The opportunity prioritization matrix example was created using the ConceptDraw PRO diagramming and vector drawing software extended with the solution "Seven Management and Planning Tools" from the Management area of ConceptDraw Solution Park.
The opportunity prioritization matrix example was created using the ConceptDraw PRO diagramming and vector drawing software extended with the solution "Seven Management and Planning Tools" from the Management area of ConceptDraw Solution Park.
Prioritization matrix
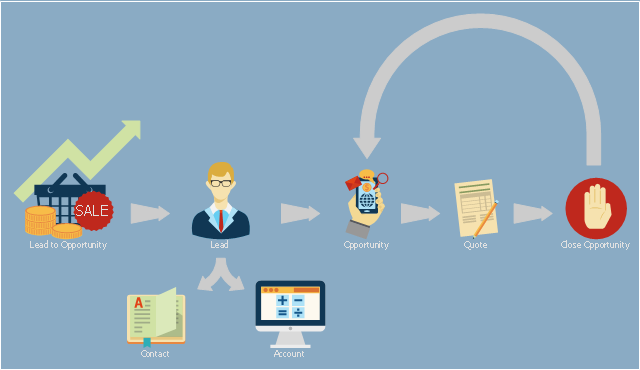
This presales process flowchart example depicts the Microsoft Dynamics CRM workflow from lead to opportunity. It was redesigned from the Wikimedia Commons file: Lead to Opportunity sales flow.svg. [commons.wikimedia.org/ wiki/ File:Lead_ to_ Opportunity_ sales_ flow.svg]
"Presales is a process or a set of activities normally carried out before a customer is acquired, though sometimes presales also extends into the period the product or service is delivered to the customer. ...
In a typical sales cycle the stages are:
(1) Contact.
(2) Lead / Suspect.
(3) Prospect / Opportunity.
The task of a presales person starts from the initial contact phase and often ends once the customer is acquired i.e. sale is made." [Presales. Wikipedia]
The process flowchart example "Lead to opportunity sales flow" was created using the ConceptDraw PRO diagramming and vector drawing software extended with the Sales Flowcharts solution from the Marketing area of ConceptDraw Solution Park.
Presales process flowchart
TOWS Matrix

 Cross-Functional Flowcharts
Cross-functional flowcharts are powerful and useful tool for visualizing and analyzing complex business processes which requires involvement of multiple people, teams or even departments. They let clearly represent a sequence of the process steps, the order of operations, relationships between processes and responsible functional units (such as departments or positions).
Sales Process Map

- Replacing engine oil - Opportunity flowchart | Order processing ...
- Example Of Opportunities In Software
- Lead to opportunity sales flow | Business diagrams & Org Charts ...
- Prioritization Matrix | Opportunity prioritization matrix | Sales activity ...
- Invoice lifecycle | Lead to opportunity sales flow | Sales Flowcharts ...
- Lead to opportunity sales flow | Process flow diagram - Typical oil ...
- Work Order Process Flowchart. Business Process Mapping ...
- PROBLEM ANALYSIS. Prioritization Matrix | Prioritization Matrix ...
- Replacing engine oil - Opportunity flowchart | Basic Flowchart ...
- Workflow - Lead to Opportunity | Lead to opportunity sales flow ...
- ERD | Entity Relationship Diagrams, ERD Software for Mac and Win
- Flowchart | Basic Flowchart Symbols and Meaning
- Flowchart | Flowchart Design - Symbols, Shapes, Stencils and Icons
- Flowchart | Flow Chart Symbols
- Electrical | Electrical Drawing - Wiring and Circuits Schematics
- Flowchart | Common Flowchart Symbols
- Flowchart | Common Flowchart Symbols