The vector stencils library "Logic gate diagram" contains 17 logical element symbols.
Use these shapes for drawing the logic gate diagrams in the ConceptDraw PRO diagramming and vector drawing software extended with the Electrical Engineering solution from the Engineering area of ConceptDraw Solution Park.
www.conceptdraw.com/ solution-park/ engineering-electrical
Use these shapes for drawing the logic gate diagrams in the ConceptDraw PRO diagramming and vector drawing software extended with the Electrical Engineering solution from the Engineering area of ConceptDraw Solution Park.
www.conceptdraw.com/ solution-park/ engineering-electrical
AND gate

OR gate

NOR gate (NOT OR)
-logic-gate-diagram---vector-stencils-library.png--diagram-flowchart-example.png)
NAND gate (NOT AND)
-logic-gate-diagram---vector-stencils-library.png--diagram-flowchart-example.png)
NOT gate (inverter)
-logic-gate-diagram---vector-stencils-library.png--diagram-flowchart-example.png)
EX-OR (Exclusive-OR) gate
-gate-logic-gate-diagram---vector-stencils-library.png--diagram-flowchart-example.png)
EX-NOR (Exclusive-NOR) gate
-gate-logic-gate-diagram---vector-stencils-library.png--diagram-flowchart-example.png)
Group

Operational Amplifier

Alternative Operational Amplifier

Norton op-amp

NOT gate (inverter)
-logic-gate-diagram---vector-stencils-library.png--diagram-flowchart-example.png)
NAND gate (NOT AND)
-logic-gate-diagram---vector-stencils-library.png--diagram-flowchart-example.png)
NOR gate (NOT OR)
-logic-gate-diagram---vector-stencils-library.png--diagram-flowchart-example.png)
Buffer

Gate with Open-Collector Output

Gate with Schmitt Trigger Input

Process Flowchart


The vector stencils library "Logic gate diagram" contains 17 logical element symbols.
Use these shapes for drawing the logic gate diagrams in the ConceptDraw PRO diagramming and vector drawing software extended with the Electrical Engineering solution from the Engineering area of ConceptDraw Solution Park.
www.conceptdraw.com/ solution-park/ engineering-electrical
Use these shapes for drawing the logic gate diagrams in the ConceptDraw PRO diagramming and vector drawing software extended with the Electrical Engineering solution from the Engineering area of ConceptDraw Solution Park.
www.conceptdraw.com/ solution-park/ engineering-electrical
AND gate
OR gate
NOR gate (NOT OR)
NAND gate (NOT AND)
NOT gate (inverter)
EX-OR (Exclusive-OR) gate
EX-NOR (Exclusive-NOR) gate
Group
Operational Amplifier
Alternative Operational Amplifier
Norton op-amp
NOT gate (inverter)
NAND gate (NOT AND)
NOR gate (NOT OR)
Buffer
Gate with Open-Collector Output
Gate with Schmitt Trigger Input
Electrical Symbols — Logic Gate Diagram

26 libraries of the Electrical Engineering Solution of ConceptDraw PRO make your electrical diagramming simple, efficient, and effective. You can simply and quickly drop the ready-to-use objects from libraries into your document to create the electrical diagram.
Sales Dashboard - insight about potential opportunities and key sales operations

Process Flow Diagram

ConceptDraw PRO diagramming and vector drawing software extended with powerful tools of Flowcharts Solution from the "Diagrams" Area of ConceptDraw Solution Park is effective for drawing: Process Flow Diagram, Flow Process Diagram, Business Process Flow Diagrams.
Audit Steps

Functional Flow Block Diagram

Basic Flowchart Symbols and Meaning


Cross-Functional Flowchart

Use cross-functional flowcharts to show the relationship between a business process and the functional units (such as departments) responsible for that process. To create it use the best flowchart maker of ConceptDraw PRO.

Types of Flowcharts


UML Activity Diagram

Use ConceptDraw PRO diagramming and vector drawing software enhanced with Rapid UML solution from ConceptDraw Solution Park to create your own UML activity diagrams that show the business and operational workflows of components and overall flow of control in your systems. Such software provides coloring UML diagrams for various purposes and simplifying work of the engineers.
Total Quality Management Value

How to Create Flowcharts for an Accounting Information System

Flowcharts help users of Accounting Information System to understand the step sequences of accounting processes. Use ConceptDraw PRO with Accounting Flowcharts solution to document and communicate visually how accounting processes work, and how each operation is done.
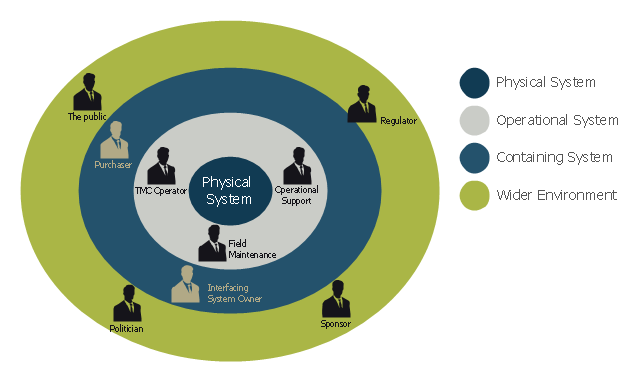
This onion diagram example was designed on the base of figure "Stakeholders for a System" in the slide presentation "A103: Introduction to ITS Standards Requirements Development" from the U.S. Department of Transportation (US DOT) website.
"“Stakeholders for a System.” A graphic of four concentric circles arranged like an archery target. The innermost circle is a reddish tan. The three bands of colors that are further from the center are in lighter shades of tan. This is called an “onion diagram” as onions are made up of multiple layers. The inner circle is labeled “Physical System.” The next layer outward is labeled “Operational System.” The next layer outward is labeled “Containing System.” The outermost layer is labeled “Wider Environment.” There are smaller black graphics of person positioned in the different layers of the diagram. Each person has a project role next to it as follows: 1) Inner Circle has no people – It represents the system; 2) Next Layer Outward has three people labeled TMC Operator, Field Maintenance, and Operational Support respectively; 3) Next Layer Outward has two people labeled Interfacing System Owner and Purchaser respectively; and 4) Outermost Layer has four people labeled Sponsor of the Project, Regulatory Agency, Public, and Politician respectively. The picture demonstrates while they are all stakeholders, different stakeholders have different levels of influence on the physical system to be defined. The most influence coming from those closest to the center."
[pcb.its.dot.gov/ standardstraining/ mod04/ ppt/ m04ppt.htm]
The onion diagram example "System stakeholders diagram" was drawn using the ConceptDraw PRO software extended with the Stakeholder Onion Diagrams solution from the Management area of ConceptDraw Solution Park.
Onion diagram example
- Business Operational Flow Chart
- Sample Operational Flow Chart
- Operational Level Management Information System
- 8ms Of Operational Management
- Operational Plan Flow Chart
- Operational Control In Mis Triangle
- Operational Level Systems
- Operational Scenario Swim Line Diagram
- Operational Support System Diagram
- Components Of Payroll System And Operational Process To ...
- Operational Level Flowchart
- Operational Support System Flowchart
- Coffee Shop Operational Plan
- Clipart Operational Plan
- Sample Of Operational Framework Diagram Of Car Rental ...
- Identify Operational Master Erd
- Operational Plan Template Word
- Operational Model Of Tqm
- 8ms Of Operations Management
- Operational Flow Chart Examples
- ERD | Entity Relationship Diagrams, ERD Software for Mac and Win
- Flowchart | Basic Flowchart Symbols and Meaning
- Flowchart | Flowchart Design - Symbols, Shapes, Stencils and Icons
- Flowchart | Flow Chart Symbols
- Electrical | Electrical Drawing - Wiring and Circuits Schematics
- Flowchart | Common Flowchart Symbols
- Flowchart | Common Flowchart Symbols