Amazon Web Services Diagrams diagramming tool for architecture

In searching of alternative to MS Visio for MAC and PC with ConceptDraw DIAGRAM

Visio for mac — ConceptDraw as an alternative to MS Visio. ConceptDraw has been developed to satisfy all your needs as a fully-functioned alternative product to MS Visio for Mac.
HelpDesk
How to Open MS Visio® 2013/2016 Files on a Mac®
Functional Block Diagram

Network Diagram Software. LAN Network Diagrams. Physical Office Network Diagrams


Entity Relationship Diagram - ERD - Software for Design Crows Foot ER Diagrams
_Win_Mac.png)

ConceptDraw DIAGRAM : Able to Leap Tall Buildings in a Single Bound

HelpDesk
How to Edit Grouped Objects on PC
HelpDesk
How to Edit Grouped Objects on Mac

IDEF0 standard with ConceptDraw DIAGRAM

According to the IDEF0 standard any process can be described in the form of a block (Activity Box) which has inputs and outputs. The process consists in transformation of inputs into outputs under the influence of the management and in the presence of necessary resources. Outputs of the given process later on can be either inputs for the next process or resources, or management means.
 Accounting Flowcharts
Accounting Flowcharts solution extends ConceptDraw DIAGRAM software with templates, samples and library of vector stencils for drawing the accounting flow charts.
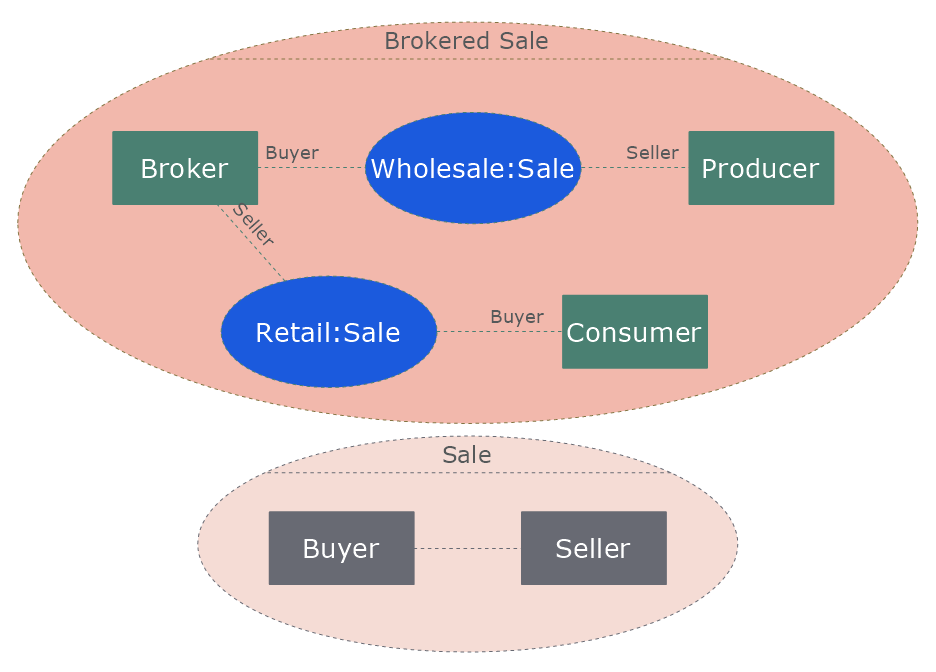
 Entity-Relationship Diagram (ERD)
Entity-Relationship Diagram (ERD) solution extends ConceptDraw DIAGRAM software with templates, samples and libraries of vector stencils from drawing the ER-diagrams by Chen's and crow’s foot notations.
Project — Assigning Resources


HelpDesk
How to Create Data-Driven Infographics

HelpDesk
How to Perform a Presentation on Mac Using Two Monitors

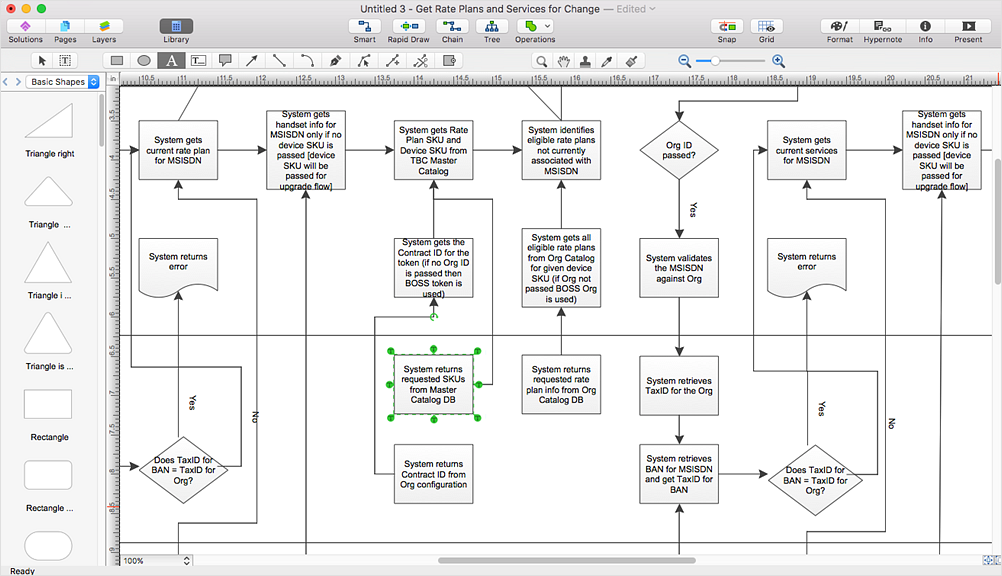
- Online Visio Editor Free
- Online Visio Editor
- Free Online Visio Editor
- Visio Online Editor
- Online Microsoft Visio Editor
- Create Idef0 Diagrams Online
- Office Online Visio
- Ms Visio Online Editor
- Edit Visio Online
- Diagram Editor Online
- Online Uml Diagram Editor
- Online Ms Visio Editor
- Visio Tool Online
- UML Diagram Editor | Swim Lane Diagrams | Entity-Relationship ...
- Online Diagram Tool | UML Component Diagram Example - Online ...
- Online Diagram Tool | UML Component Diagram Example - Online ...
- UML Diagram Visio | Visio Files and ConceptDraw | MS Visio Look a ...
- Online Diagram Tool | UML Component Diagram Example - Online ...
- Prepare An Object Diagram For A Graphical Document Editor
- Online Diagram Tool | UML Component Diagram Example - Online ...
- ERD | Entity Relationship Diagrams, ERD Software for Mac and Win
- Flowchart | Basic Flowchart Symbols and Meaning
- Flowchart | Flowchart Design - Symbols, Shapes, Stencils and Icons
- Flowchart | Flow Chart Symbols
- Electrical | Electrical Drawing - Wiring and Circuits Schematics
- Flowchart | Common Flowchart Symbols
- Flowchart | Common Flowchart Symbols