Online Diagram Tool
UML Component Diagram Example - Online Shopping

This sample shows the concept of the online shopping and is used for the understanding of the online shopping processes, of the online shops working processes, for projection and creating of the online stores.
 ConceptDraw Solution Park
ConceptDraw Solution Park collects graphic extensions, examples and learning materials
UML Activity Diagram

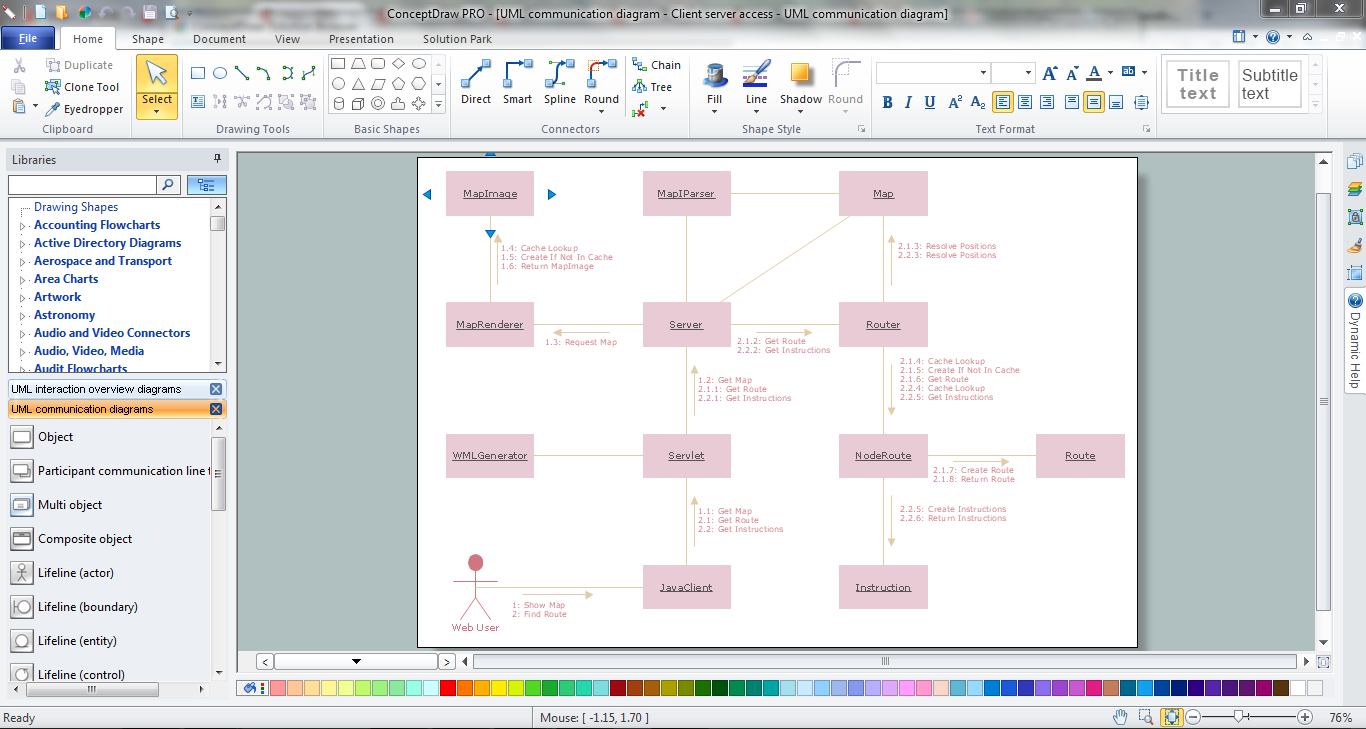
Use ConceptDraw DIAGRAM diagramming and vector drawing software enhanced with Rapid UML solution from ConceptDraw Solution Park to create your own UML activity diagrams that show the business and operational workflows of components and overall flow of control in your systems. Such software provides coloring UML diagrams for various purposes and simplifying work of the engineers.
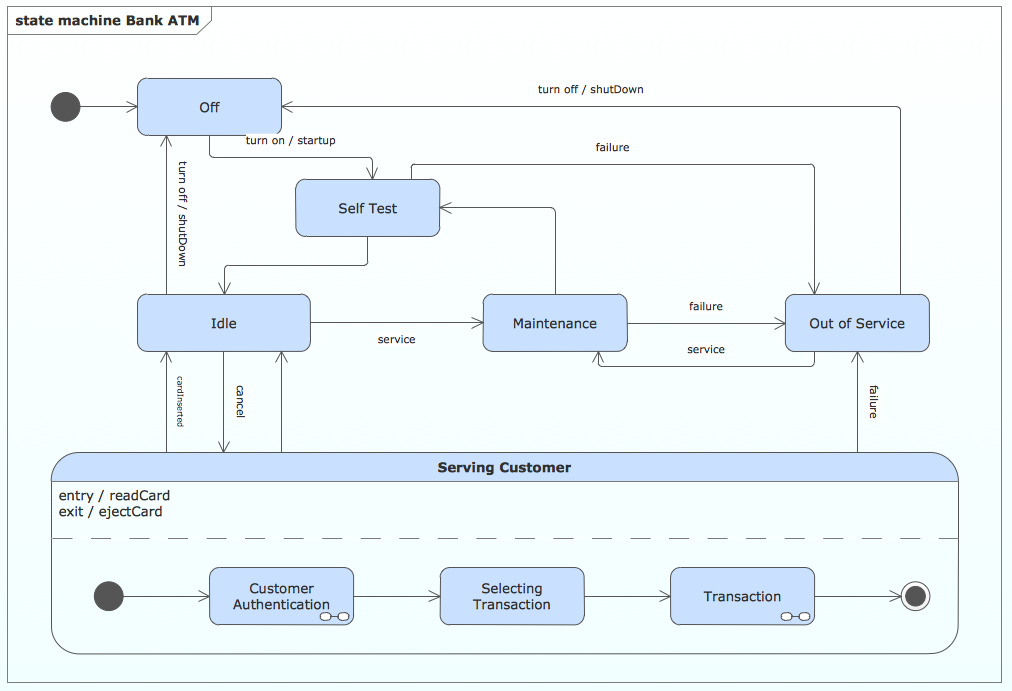
State Machine Diagram

UML Deployment Diagram
Use ConceptDraw DIAGRAM with UML deployment diagram templates, samples and stencil library from Rapid UML solution to model the physical deployment of artifacts on nodes of your software system.
ConceptDraw Solution Park
ConceptDraw Solution Park collects graphic extensions, examples and learning materials
 Fishbone Diagram
Fishbone Diagrams solution extends ConceptDraw DIAGRAM software with templates, samples and library of vector stencils for drawing the Ishikawa diagrams for cause and effect analysis.
How to create your UML Diagram
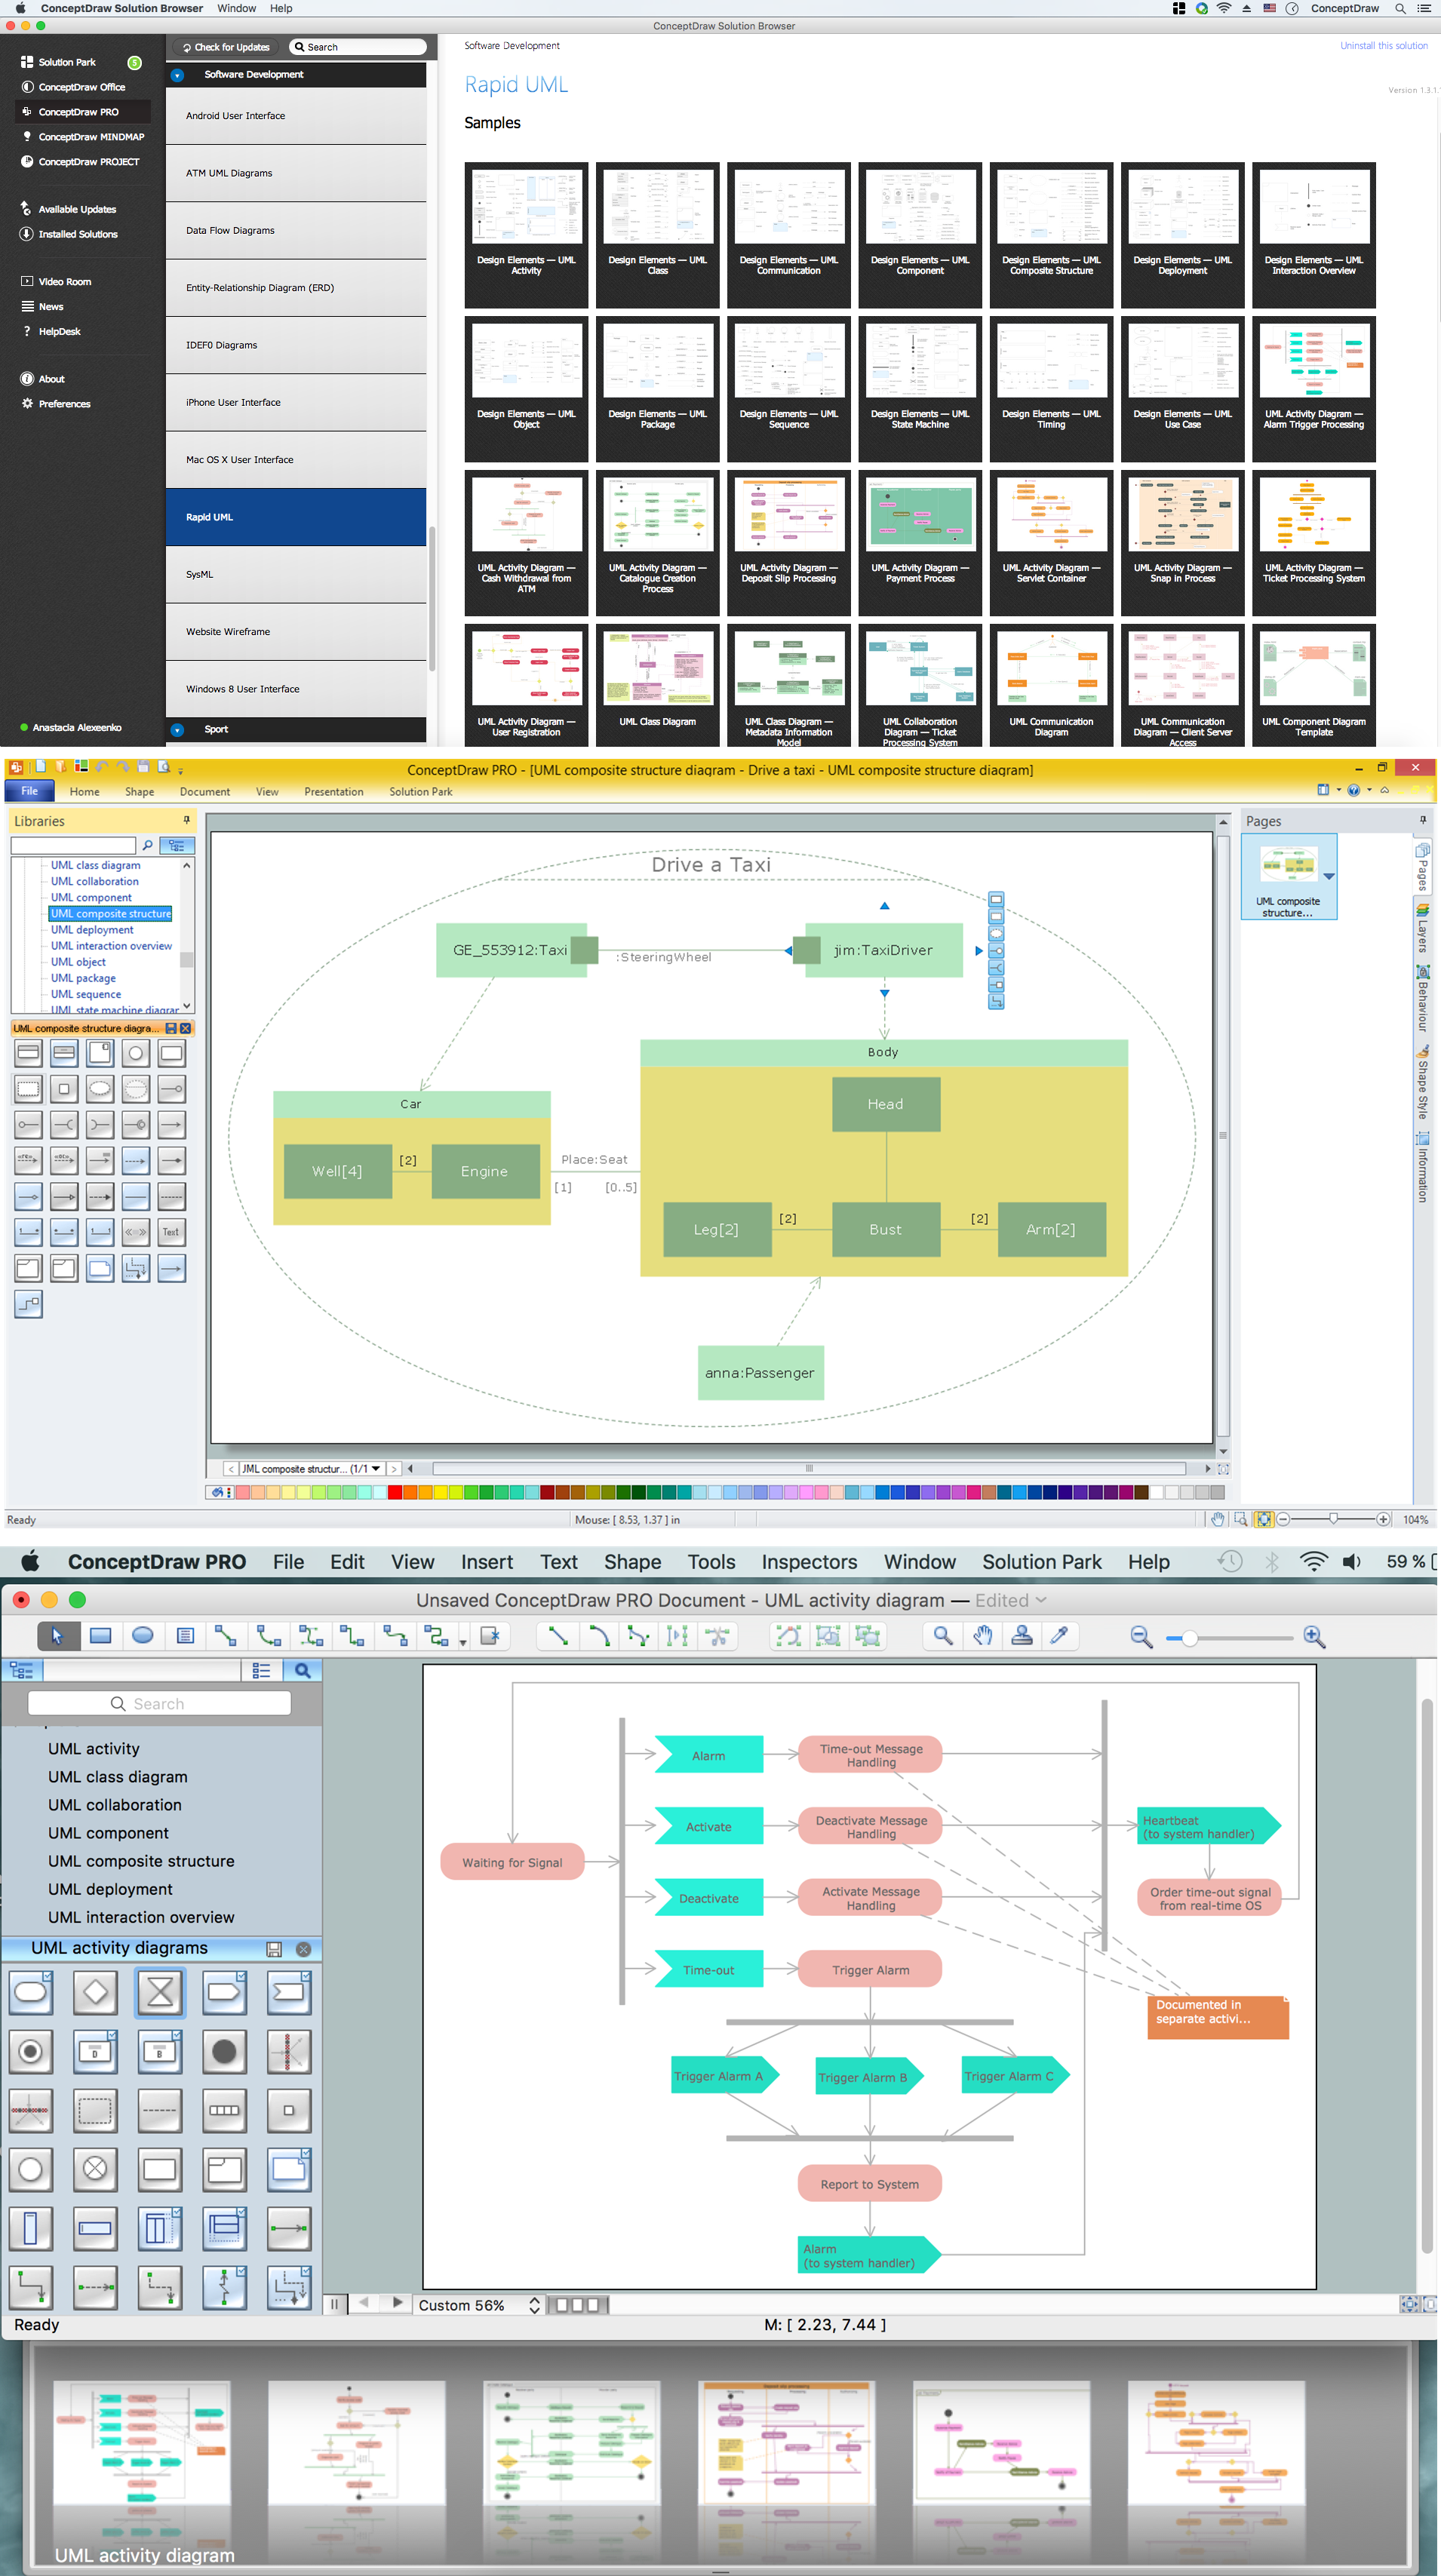
The 13 diagrams contained in the Rapid UML Solution offer an essential framework for systems analysts and software architects to create the diagrams they need to model processes from the conceptual level on through to project completion.
HelpDesk
How To Create a PERT Chart Using PM Easy Solution

 ATM UML Diagrams
The ATM UML Diagrams solution lets you create ATM solutions and UML examples. Use ConceptDraw DIAGRAM as a UML diagram creator to visualize a banking system.
 Fault Tree Analysis Diagrams
This solution extends ConceptDraw DIAGRAM.5 or later with templates, fault tree analysis example, samples and a library of vector design elements for drawing FTA diagrams (or negative analytical trees), cause and effect diagrams and fault tree diagrams.
Diagramming Software for Design UML Activity Diagrams

ConceptDraw DIAGRAM Compatibility with MS Visio

HelpDesk
How to Create a Hook-Up Diagram

HelpDesk
How to a Draw Biology Diagram

Data structure diagram with ConceptDraw DIAGRAM

HelpDesk
How to Create a CCTV Diagram

CCTV diagram should include the scheme of strategic placement of video cameras, which capture and transmit videos to either a private network of monitors for real-time viewing or to a video recorder for later reference. CCTV is commonly used for surveillance and security purposes. Using ConceptDraw DIAGRAM with the Security and Access Plans Solution lets you create professional looking video surveillance CCTV system plans, security plans, and access schemes.
- UML Component Diagram Example - Online Shopping | UML Tool ...
- Online Diagram Tool | UML Component Diagram Example - Online ...
- UML Component Diagram Example - Online Shopping | State ...
- How to create your UML Diagram | UML Tool & UML Diagram ...
- UML Tool & UML Diagram Examples
- State Diagram Example - Online Store | UML Component Diagram ...
- Online Diagram Tool | Cross-Functional Flowcharts | Sequence ...
- Example of DFD for Online Store ( Data Flow Diagram ) DFD Example
- UML Tool & UML Diagram Examples | State Diagram Example ...
- UML Deployment Diagram Example - ATM System | UML ...
- UML Tool & UML Diagram Examples | UML Component Diagram ...
- UML Deployment Diagram
- UML Component Diagram . Design Elements | Diagramming ...
- Diagramming Software for Design UML Component Diagrams | UML ...
- Store Layout Software | State Diagram Example - Online Store ...
- UML Component Diagram
- UML Deployment Diagram
- UML Diagrams with ConceptDraw PRO | UML Business Process ...
- UML Deployment Diagram
- Diagramming Software for Design UML State Machine Diagrams ...
- ERD | Entity Relationship Diagrams, ERD Software for Mac and Win
- Flowchart | Basic Flowchart Symbols and Meaning
- Flowchart | Flowchart Design - Symbols, Shapes, Stencils and Icons
- Flowchart | Flow Chart Symbols
- Electrical | Electrical Drawing - Wiring and Circuits Schematics
- Flowchart | Common Flowchart Symbols
- Flowchart | Common Flowchart Symbols