Example of DFD for Online Store (Data Flow Diagram)

Example of DFD for Online Store shows the Data Flow Diagram for online store and interactions between the Visitors, Customers and Sellers, as well as Website Information and User databases.

 Data Flow Diagrams (DFD)
Data Flow Diagrams solution extends ConceptDraw DIAGRAM software with templates, samples and libraries of vector stencils for drawing the data flow diagrams (DFD).
UML Component Diagram Example - Online Shopping

This sample shows the concept of the online shopping and is used for the understanding of the online shopping processes, of the online shops working processes, for projection and creating of the online stores.
 Fishbone Diagrams
The Fishbone Diagrams solution extends ConceptDraw DIAGRAM software with the ability to easily draw the Fishbone Diagrams (Ishikawa Diagrams) to clearly see the cause and effect analysis and also problem solving. The vector graphic diagrams produced using this solution can be used in whitepapers, presentations, datasheets, posters, and published technical material.
Online Diagram Tool
Diagramming Software for Design UML Object Diagrams
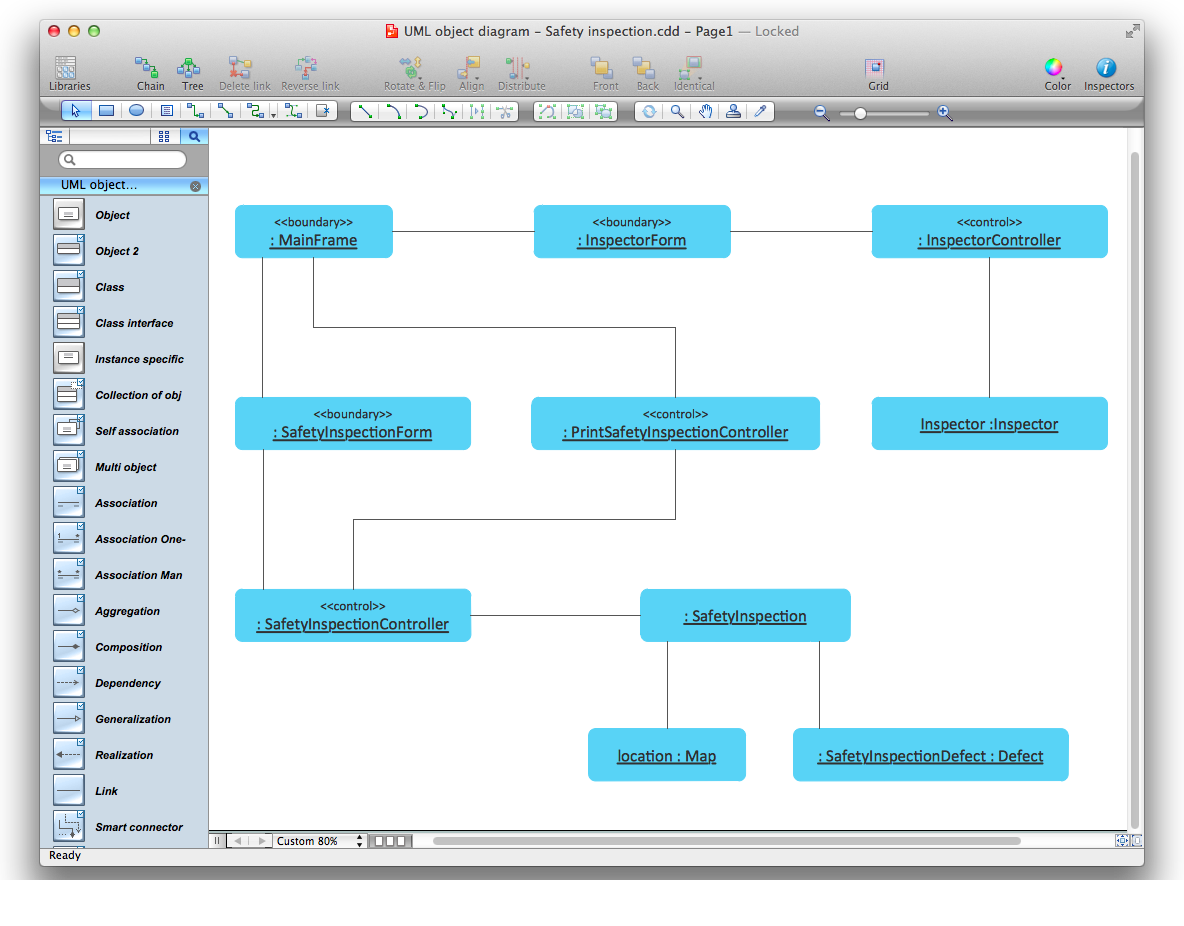
ConceptDraw Rapid UML solution delivers libraries contain pre-designed objects fit UML notation, and ready to draw professional UML Object Diagram.

 Active Directory Diagrams
Active Directory Diagrams solution significantly extends the capabilities of ConceptDraw DIAGRAM software with special Active Directory samples, convenient template and libraries of Active Directory vector stencils, common icons of sites and services, icons of LDPA elements, which were developed to help you in planning and modelling network structures and network topologies, in designing excellently looking Active Directory diagrams, Active Directory Structure diagrams, and Active Directory Services diagram, which are perfect way to visualize detailed structures of Microsoft Windows networks, Active Directory Domain topology, Active Directory Site topology, Organizational Units (OU), and Exchange Server organization.
 Value Stream Mapping
Value stream mapping solution extends ConceptDraw DIAGRAM software with templates, samples and vector stencils for drawing the Value Stream Maps (VSM) in lean manufacturing practice.
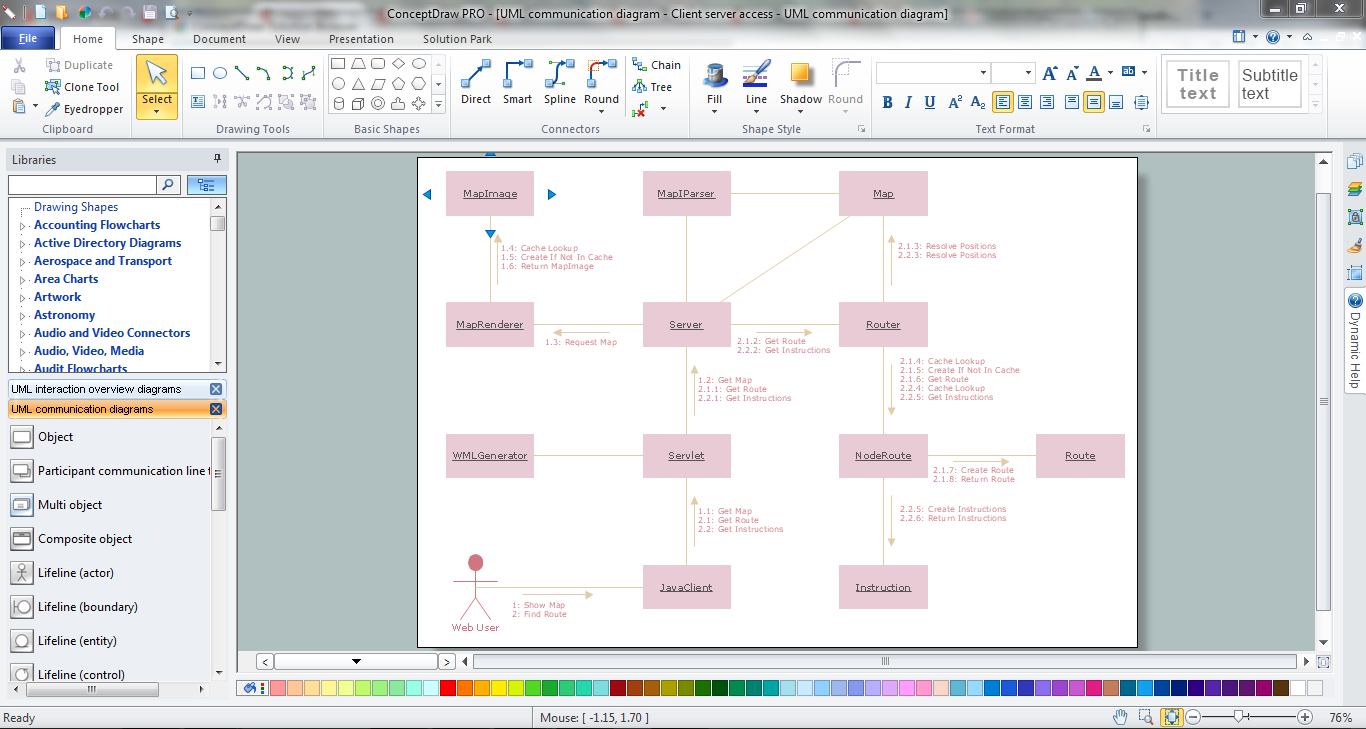
UML Deployment Diagram. Design Elements

ConceptDraw has 393 vector stencils in the 13 libraries that helps you to start using software for designing your own UML Diagrams. You can use the appropriate stencils of UML notation from UML Deployment library.
 Audit Flowcharts
Audit flowcharts solution extends ConceptDraw DIAGRAM software with templates, samples and library of vector stencils for drawing the audit and fiscal flow charts.
IDEF3 Standard

 Telecommunication Network Diagrams
Telecommunication Network Diagrams solution extends ConceptDraw DIAGRAM software with samples, templates, and great collection of vector stencils to help the specialists in a field of networks and telecommunications, as well as other users to create Computer systems networking and Telecommunication network diagrams for various fields, to organize the work of call centers, to design the GPRS networks and GPS navigational systems, mobile, satellite and hybrid communication networks, to construct the mobile TV networks and wireless broadband networks.
 Business Process Diagrams
Business Process Diagrams solution extends the ConceptDraw DIAGRAM BPM software with RapidDraw interface, templates, samples and numerous libraries based on the BPMN 1.2 and BPMN 2.0 standards, which give you the possibility to visualize equally easy simple and complex processes, to design business models, to quickly develop and document in details any business processes on the stages of project’s planning and implementation.
 PM Presentations
The PM Presentations solution extends the power of ConceptDraw MINDMAP , ConceptDraw DIAGRAM , and ConceptDraw PROJECT, improving their efficiency at many stages of the project management process by using the same source data to construct the targeted presentation for your audience and clearly communicating the appropriate information to different audiences from a single source. It gives an ability to project managers and other team participants to create and to deliver capacious presentations representing the data and knowledge of a specific project with the help of including visual dashboards, Gantt charts, resource views, maps, timelines, calendars, illustrations, project diagrams and reports of varied types. Having the possibility to edit collaboratively in a Full-Screen Mode, the teams can rapidly plan a project as well as execute the tasks of revising and making changes to it.
 Enterprise Architecture Diagrams
Enterprise Architecture Diagrams solution extends ConceptDraw DIAGRAM software with templates, samples and library of vector stencils for drawing the diagrams of enterprise architecture models.
- Data Flow Diagram For Electronic Shop Management System
- Example of DFD for Online Store ( Data Flow Diagram ) DFD ...
- Example of DFD for Online Store ( Data Flow Diagram ) DFD ...
- Example of DFD for Online Store ( Data Flow Diagram ) DFD ...
- Example of DFD for Online Store ( Data Flow Diagram ) DFD ...
- UML Component Diagram Example - Online Shopping | State ...
- Example of DFD for Online Store ( Data Flow Diagram ) DFD ...
- Sequence Diagram For Electronic Shop Management System Project
- Example of DFD for Online Store ( Data Flow Diagram ) DFD ...
- UML Class Diagram Example - Medical Shop | UML Tool & UML ...
- UML Class Diagram Example - Medical Shop | UML Component ...
- UML Class Diagram Example - Medical Shop | Example of DFD for ...
- Example of DFD for Online Store ( Data Flow Diagram ) DFD ...
- Example of DFD for Online Store ( Data Flow Diagram ) DFD ...
- Example of DFD for Online Store ( Data Flow Diagram ) DFD ...
- UML Class Diagram Example - Medical Shop | State Diagram ...
- Example of DFD for Online Store ( Data Flow Diagram ) DFD ...
- Data Flow Diagrams (DFD) | How to Connect Social Media DFD ...
- UML Class Diagram Example - Medical Shop | UML Collaboration ...
- Example of DFD for Online Store ( Data Flow Diagram ) DFD ...
- ERD | Entity Relationship Diagrams, ERD Software for Mac and Win
- Flowchart | Basic Flowchart Symbols and Meaning
- Flowchart | Flowchart Design - Symbols, Shapes, Stencils and Icons
- Flowchart | Flow Chart Symbols
- Electrical | Electrical Drawing - Wiring and Circuits Schematics
- Flowchart | Common Flowchart Symbols
- Flowchart | Common Flowchart Symbols