This site uses cookies. By continuing to browse the ConceptDraw site you are agreeing to our Use of Site Cookies.

Flow Chart Online

Flow Chart is a great visualization tool for the flow of a process, algorithm or procedure with a lot of benefits. It is convenient to use a powerful software for creating flow charts. Now we have the best flow chart maker online design software - ConceptDraw DIAGRAM enhanced with Flowcharts Solution from the "Diagrams" Area of ConceptDraw Solution Park.

Data Flow Diagram Software

When studying a business process or system that involves the transfer of data, it is common to use a data flow diagram (DFD) to visualize how that data is processed. While initially used exclusively in regards to the flow of data through a computer system, DFDs are now employed as a business modelling tool, describing business events and interactions, or physical systems involving data storage and transfer.
ConceptDraw DIAGRAM is a powerful Data Flow Diagram Software thanks to the Data Flow Diagrams solution from the Software Development area of ConceptDraw Solution Park.
You can use the predesigned DFD vector objects that are grouped in 3 libraries of Data Flow Diagrams solution: Data Flow Diagrams Library; Gane-Sarson Notation Library; Yourdon and Coad Notation Library.

ConceptDraw DIAGRAM DFD Software

Our DFD software ConceptDraw DIAGRAM allows you to quickly create DFD with data storages, external entities, functional transforms, data flows, as well as control transforms and signals. DFD program ConceptDraw DIAGRAM has hundreds of templates, and a wide range of libraries with all nesassary ready-made drag-and-drop.

Example of DFD for Online Store (Data Flow Diagram)

Data flow diagrams (DFDs) reveal relationships among and between the various components in a program or system. DFDs are an important technique for modeling a system’s high-level detail by showing how input data is transformed to output results through a sequence of functional transformations.
Example of DFD for Online Store shows the Data Flow Diagram for online store and interactions between the Visitors, Customers and Sellers, as well as Website Information and User databases.
Steps to Creating a Sales Process Flow Chart

Amazon Web Services Diagrams diagramming tool for architecture

The AWS Architecture Diagrams solution includes icons, sample and templates for several Amazon Web Services products and resources, to be used when creating architecture diagrams. The icons are designed to be simple so that you can easily incorporate them in your diagrams and put them in your whitepapers, presentations, datasheets, posters or any technical material you like. Here you will find an official collection of AWS resources that will help you build great AWS Architecture diagrams.

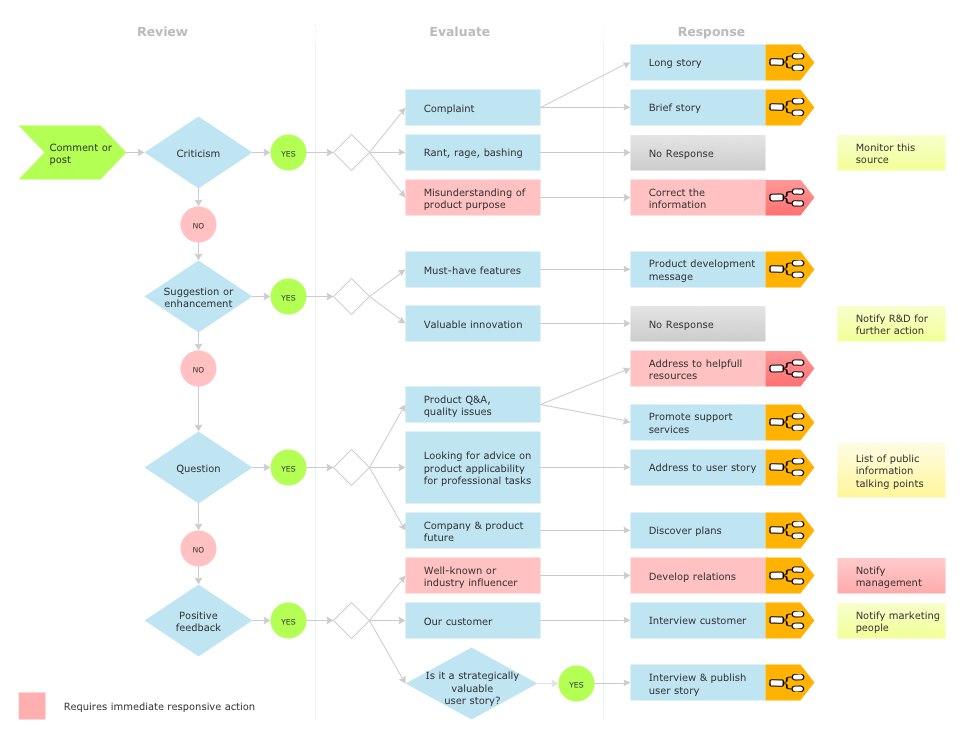
Social Media Response DFD Flowcharts - diagramming software ( Mac PC )

Diagramming software for Mac and PC - create flowcharts and presentations for Social Media Organizing.

Entity Relationship Diagram - ERD - Software for Design Crows Foot ER Diagrams

Crow's Foot notation was proposed by Gordon Everest. According to this notation, the entity is represented by rectangle, relation is depicted by line which ties two entities involved in a relationship. Entity-relationship diagrams based on both Chen's and Crow's Foot notations, can be easily drawn using the ConceptDraw DIAGRAM ERD diagrams software tools for design element Crow's Foot and Chen from Entity-Relationship Diagram (ERD) solution.
How to Build an Entity Relationship Diagram (ERD)

Cross-Functional Flowchart

Cross-Functional Flowchart - to draw cross functional process maps is by starting with a cross-functional flowchart samples and templates. Easy to draw sample cross functional Process Flow Diagrams. Using a Cross-Functional flowchart is a clear way of showing each team member’s responsibilities and how processes get shared or transferred between different teams and departments.
Use cross-functional flowcharts to show the relationship between a business process and the functional units (such as departments) responsible for that process. To create it use the best flowchart maker of ConceptDraw DIAGRAM.
How to Draw a Cross Functional Flowchart using visio alternative ConceptDraw DIAGRAM as visio for mac

Process Flowchart

ConceptDraw is Professional business process mapping software for making process flow diagram, workflow diagram, general flowcharts and technical illustrations for business documents. It is includes rich examples, templates, process flowchart symbols. ConceptDraw flowchart maker allows you to easier create a process flowchart. Use a variety of drawing tools, smart connectors, flowchart symbols and shape libraries to create flowcharts of complex processes, process flow diagrams, procedures and information exchange.
How To Create a Process Flow Chart (business process modelling techniques)

ConceptDraw DIAGRAM ER Diagram Tool

ER-diagram is a tool used for database modeling which allows to determine data and relationships among the data. These diagrams help to detail data storages and to document all the properties of designed system. ER-diagram contains entities, attributes of the entities and the relationships between them. Chen’s notation and Crow’s foot notation are commonly used to represent elements in ER-model. To create such diagram you should use specific software, such as Entity-Relationship Diagram solution for ConceptDraw DIAGRAM.
ConceptDraw ER Diagram Tool works across any platform, meaning you never have to worry about compatibility again. ConceptDraw DIAGRAM allows you to make Entity-Relationship Diagram (ERD) on PC or macOS operating systems.